
Figure 5.
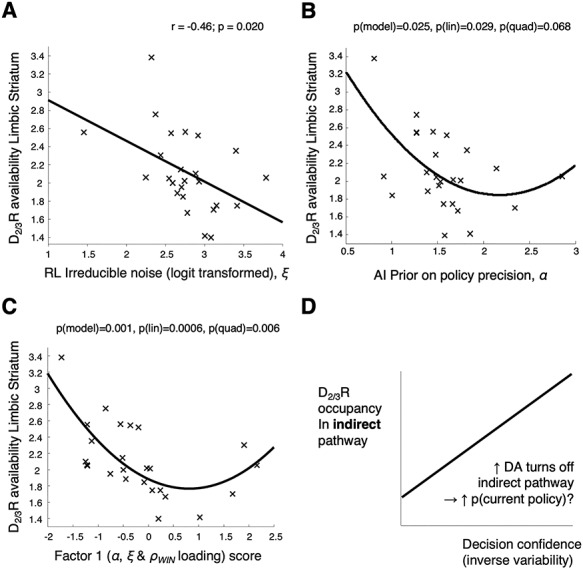
Relationships between D2/3R availability and RL and AI parameters governing response stochasticity in participants who completed PET (n = 25). (A) There is a linear relationship between irreducible decision noise  and limbic striatal D2/3R availability (measured as [11C]-(+)-PHNO BPND) in the participants who completed a PET scan (r = –0.46, 95% CI [–0.72 –0.08], P = 0.020). Here,
  was logit transformed as it was not normally distributed:
  . Without the transform, the correlation remained significant (r = –0.45, 95% CI [–0.72 –0.07], P = 0.023). (B) There is a significant linear relationship between the prior on policy precision
  and D2/3R availability, βlinear = –2.1, SE = 0.91, t22 = –2.33, P =0.029; there is also evidence of a quadratic relationship but it is not significant, βquad = 0.49, SE = 0.26, t22 = 1.92, P = 0.068. (C) This plot shows the relationships between D2/3R availability and the first factor in the factor analysis of the AI and RL parameters (detailed in Fig. S9). Three parameters governing response stochasticity loaded on this factor (loadings in brackets) –
  (0.69),
  win (0.88), and
  (0.30)—and this factor has robust linear (βlinear = –0.29, SE = 0.07, t22 = –3.97, P = 0.0006) and quadratic (βquad = 1.8, SE = 0.06, t22 = 3.06, P =0.006) relationships with D2/3R availability. (D) We interpret the linear relationships in plots A–C as being due to greater tonic D2R occupancy suppressing the indirect pathway more, hence making participants’ choices more deterministic.