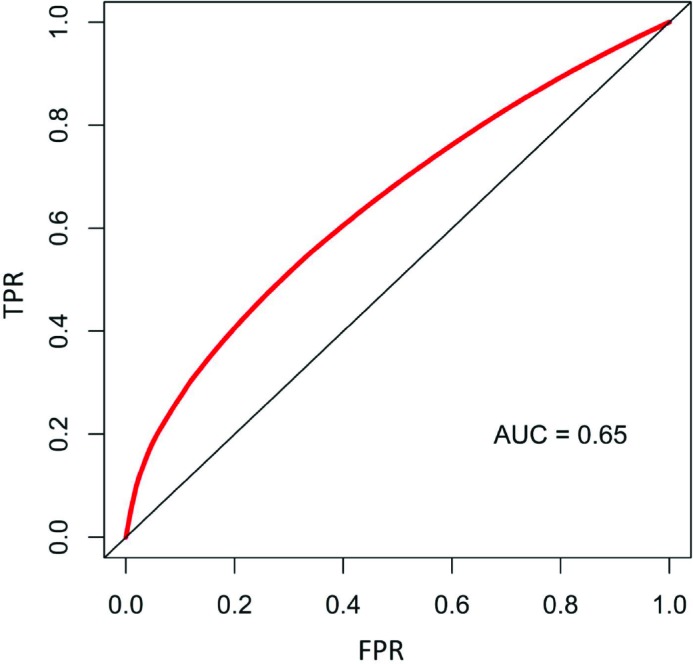
Figure 6.

The receiver operator characteristic (ROC) curve for the random survival forest model predictions at 1,500 days from initial polyp detection shows an AUC of 0.65. True positive rates (TPR) are shown on the y-axis and false positive rates (FPR) on the x-axis.
