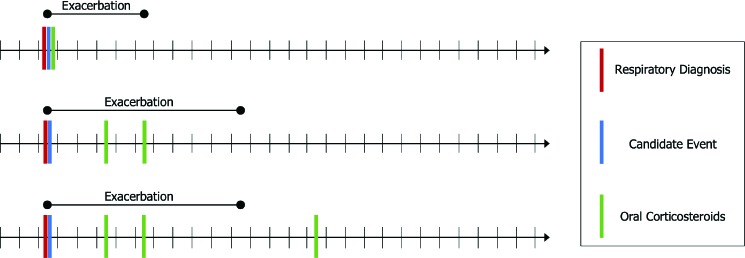
Figure 1:
An illustration of the exacerbation phenotyping task. The figure shows three example patient timelines and the resulting exacerbation event that is recognized in each. Short, vertical black lines on the timeline represent days. Vertical red, blue and green lines represent events recorded in the EHR. The duration of a phenotyped exacerbation is represented by the extent of the corresponding horizontal black line over the timeline.

