Figure 5:

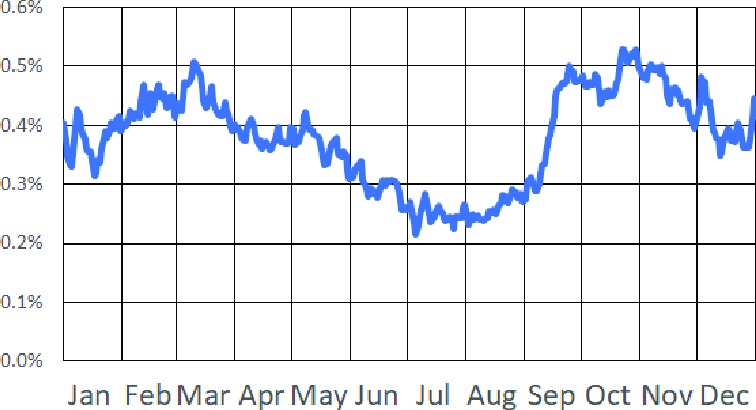
Plot of exacerbation frequency by time of year in our cohort. The y-axis represents the percentage of patients in our cohort who are in the midst of an exacerbation event on a given day of the year.

Plot of exacerbation frequency by time of year in our cohort. The y-axis represents the percentage of patients in our cohort who are in the midst of an exacerbation event on a given day of the year.