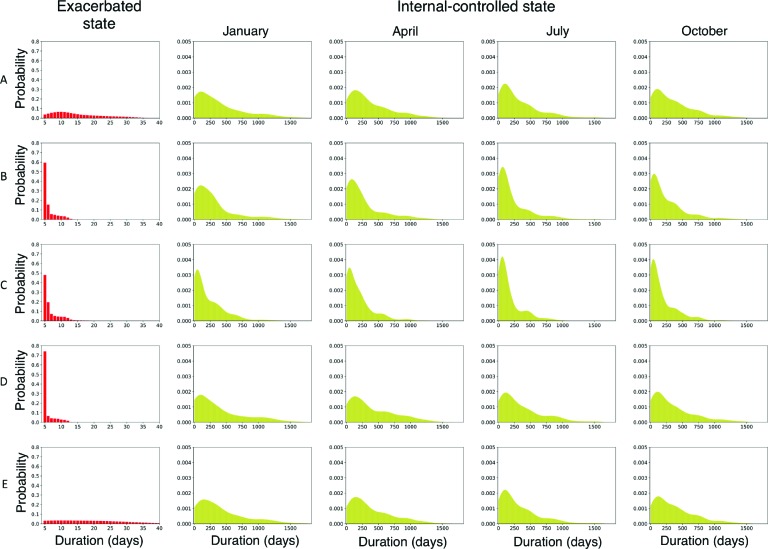
Figure 8:
Selected duration distributions from the mixture of semi-Markov models. Each row shows a selection of the learned state duration distributions for a mixture component in a 5-component model. The first column shows the duration distribution for the exacerbated state. Subsequent columns show duration distributions for the internal-controlled state, conditioned on entering the state in January, April, July or October.

