
Fig. 1. Differential sensitivity of activated M1 and alternatively activated M2 macrophages and microglia to RSL3-induced ferroptosis.
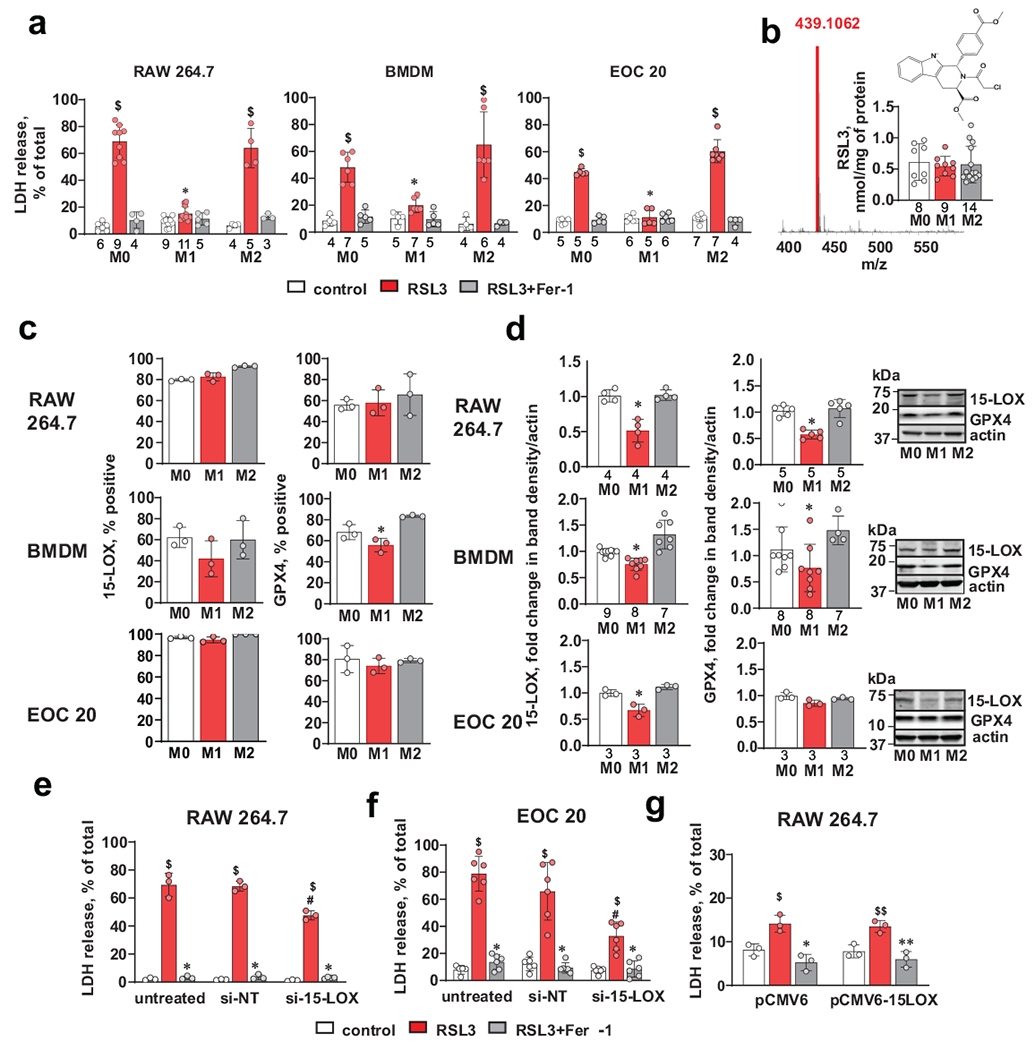
(a) Activated (M1) cells display resistance to RSL3 induced ferroptosis. RAW 264.7 macrophages, bone marrow derived macrophages (BMDM) and EOC 20 microglial cells were treated with RSL3 (500 nM) in the presence or absence of Fer-1 (400 nM) for 5 h. Data are means ± s.d.; the number of biologically independent samples are indicated on the X-axis below each bar. $p<0.0001 vs. corresponding control, *p< 0.0001 vs M2/RSL3, 2-way ANOVA, Tukey’s multiple comparison.
(b) LC-MS quantification of RSL3 in different macrophage phenotypes incubated for 5 hrs with RSL3 (500 nM) demonstrating similar amounts of the inhibitor in macrophages with different phenotypes. The number of biologically independent samples are indicated on the X-axis below each bar.
(c) Multicolor flow cytometry-based evaluation of 15-LOX and GPX4 positive cells. Data are means ± s.d., n=3 biologically independent samples, *p = 0.0308 vs corresponding M2, one-way ANOVA, Tukey’s multiple comparison.
(d) Western blots with densitometry-based quantitative assessments of mean relative intensity for 15-LOX and GPX4 in activated (M1) and alternatively activated (M2) RAW 264.7 macrophages, bone marrow derived macrophages (BMDM) and EOC 20 cells. The intensities of 15-LOX and GPX4 were normalized to those of actin and are reported as fold change to M0. Data are means ± s.d.; the number of biologically independent samples are indicated on the X-axis below each bar. P-values: RAW 264.7/15-LOX, *p=0.0004 vs M2; BMDM/15-LOX, *p< 0.0001 vs M2; EOC 20/15-LOX, *p = 0.0013 vs M2; RAW 264.7/GPX4, *p < 0.0001 vs M2; BMDM/GPX4, *p = 0.0308 vs M2; one-way ANOVA, Tukey’s multiple comparison.
(e, f) 15-LOX KD decreases sensitivity to RSL3-induced ferroptosis in alternatively activated (M2) RAW 264.7 macrophages (e) and EOC 20 cells (f). Cells were transfected with scrambled si-RNA (si-NT) or 15-LOX siRNA (si-15-LOX). Data are means ± s.d., n=3 and 6 biologically independent samples for RAW 264.7 and EOC 20 respectively. $p<0.0001 vs corresponding control, *p<0.0001 vs corresponding RSL3; #p < 0.0001 vs corresponding si-NT/RSL3.
(g) Overexpression of 15-LOX does not sensitize activated (M1) RAW264.7 macrophages to RSL3 induced ferroptosis. Cells were transfected with vector only (pCMV6) or vector containing 15-LOX (pCMV6-15-LOX). Data are means ± s.d., n=3 biologically independent samples. $p = 0.0082 vs pCMV6/control, *p = 0.0003 vs pCMV6/RSL3, $$p = 0.0120 vs pCMV6-15LOX/control; **p = 0.0013 vs pCMV6-15-LOX /RSL3, two-way ANOVA, Tukey’s multiple comparisons test.