
Fig. 2. Sensitivity of activated (M1) macrophages and microglial cells to RSL3-induced ferroptosis depends on the levels of iNOS expression.
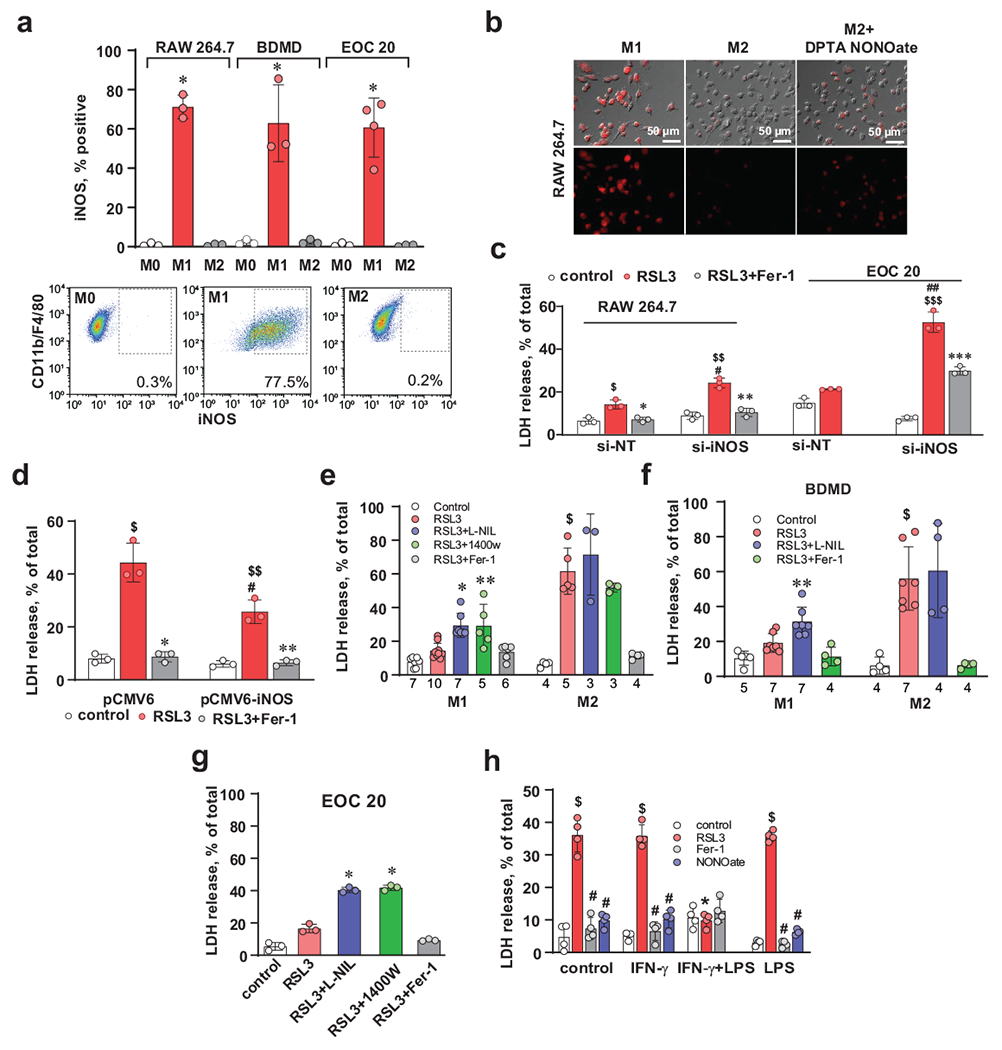
(a) Representative multicolor flow cytometry image and evaluation of the percentage of iNOS-positive cells. Data are means ± s.d., n=4 biologically independent samples for M1/EOC 20 and 3 for all other samples. *p < 0.0001 vs corresponding M2, two-way ANOVA, Tukey’s multiple comparison).
(b) Raw 264.7 macrophages activated into M1 phenotype produced high amount of NO• as assessed by live cell microscopy. Representative images from 3 independent experiments.
(c) Knock down of iNOS sensitizes activated (M1) RAW 264.7 macrophages and EOC 20 cells to RSL3-induced ferroptosis. IFN-γ treated RAW 264.7 and EOC 20 macrophages were transfected with scrambled si-RNA (si-NT) or iNOS siRNA (si-iNOS). Data are means ± s.d.; n=3 biologically independent samples. $p = 0.0022 vs si-NT/control, *p = 0.0044 vs si-NT/RSL3, $$p<0.0001 vs si-iNOS/control, **p<0.0001 vs si-iNOS/RSL3, #p = 0.0002 vs si-NT/RSL3, $$$p < 0.0001, vs si-NT/RSL3; ##p < 0.0001 vs si-iNOS/control; ***p < 0.0001 vs si-iNOS/RSL3, two-way ANOVA, Tukey’s multiple comparison.
(d) Transfection of M2 macrophages with iNOS expressing plasmid increased resistance to ferroptosis. M2 macrophages transfected with vector only (pCMV6) or iNOS expressing plasmid (pCMV6-iNOS). Data are means ± s.d.; n=3 biologically independent samples. $p < 0.0001 vs pCMV6/control; *p < 0.0001 vs pCMV6/RSL3; $$p = 0.0003 vs pCMV6-iNOS/control; **p = 0.0004 vs pCMV6-iNOS/RSL3; #p = 0.0006 vs pCMV6/RSL3, two-way ANOVA, Tukey’s multiple comparisons test. Representative Western blots of iNOS and densitometry-based quantitative assessments of mean relative intensity for the protein. *p = 0.0002, two-tailed, unpaired student’s t-test.
(e, f) iNOS inhibitors enhance RSL3-induced ferroptosis in activated (M1) RAW 264.7 macrophages (e) and bone marrow derived macrophages (f) but had no effect on alternatively activated (M2) cells. Data are means ± s.d. The number of biologically independent samples are indicated on the X-axis below each bar. $p < 0.0001 vs corresponding control, *p = 0.0283 vs M1/RSL3, **p < 0.0001 vs M1/RSL3, two-way ANOVA, Tukey’s multiple comparisons test.
(g) iNOS inhibitors enhance RSL3-induced ferroptosis in EOC 20 cells activated into M1 state. Cells were treated with RSL3 (500 nM) in the presence or absence of iNOS inhibitors (L-NILn 1400W) or Fer-1 (400 nM). Data are means ± s.d., n=3 biologically independent samples, *p < 0.0001 vs RSL3, two-way ANOVA, Tukey’s multiple comparison.
(h) RAW 264.7 gamma NO(−) macrophages expressing iNOS are resistant to RSL3-induced ferroptosis. Macrophages were activated with (IFN-γ (100 ng/ml) or IFN-γ + LPS) or LPS (10 ng/ml) for 48h. Ferroptosis was induced by treatment with RSL3 (500 nM) in the presence or absence of Fer-1 (400 nM) for 5 h. Data are means ± s.d.; $p < 0.0001 vs corresponding controls, #p < 0.0001 vs corresponding RSL3, *p < 0.0001 vs Control/RSL3, IFN-γ/RSL3, IFN-γ+LPS/RSL3, and LPS/RSL3 groups, two-way ANOVA, Tukey’s multiple comparisons test.