
Fig. 4. NO• suppresses RSL-3-induced accumulation of oxidatively modified PE species in alternatively activated (M2) RAW 264.7 macrophages.
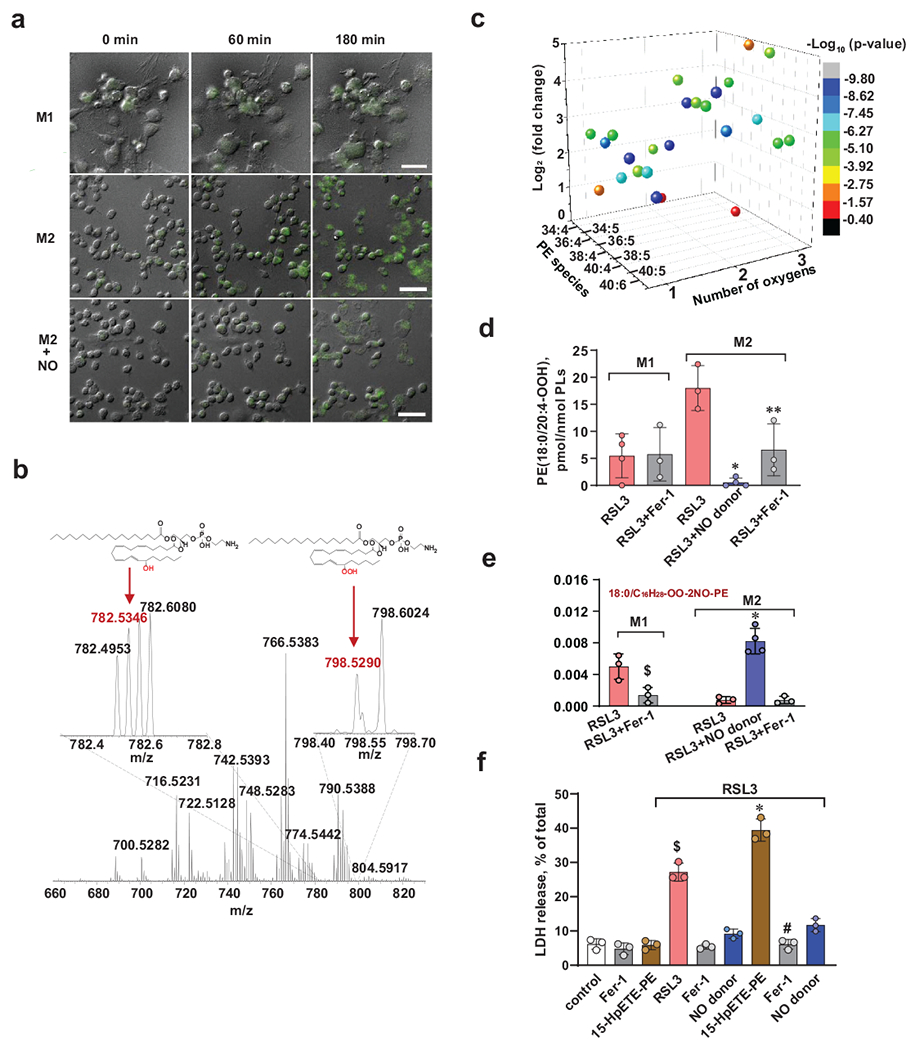
(a) Live cell fluorescence imaging of RAW 264.7 macrophages with Liperfluo. Activated (M1) or alternatively activated (M2) RAW 267.4 macrophages were treated with Liperfluo (10 μM) and RSL3 (500 nM) in the presence and absence of DPTA NONOate (25 μM). Fluorescence of Liperfluo was registered using inverted Nikon TiE fluorescent microscope (Nikon Inc.) for 3 h. Typical changes in fluorescence in one stage position (of 10) at three time points (0, 60 min, and 180 min) are shown. Representative images from 3 independent experiments
(b) Representative full MS spectra of phosphatidylethanolamines (PE) from alternatively activated (M2) RAW 264.7 macrophages. Inserts: Mass spectra of PE in the range of m/z from 782.2 to 782.8 and from 798.4 to 798.7. Spectra demonstrate the presence of peaks with m/z 782.5346 and m/z 798.5290 corresponding to 15-HETE and15HpETE-PE species, respectively. Structures of the major ferroptotic signal, C18:0/C20:4-OOH-PE (15-HpETE-PE) species, and its reduced form C18:0/15-HETE-PE are shown as well. Representative image from 3 independent experiments.
(c). 3D volcano-plot of major oxygenated arachidonoyl-PE species induced by RSL3 in M2 RAW 264.7 macrophages.
(d) Contents of ferroptotic cell death signal, 18:0/20:4-OOH-PE (15-HpETE-PE) species, in activated (M1) and alternatively activated (M2) RAW 264.7 macrophages exposed to RSL3 (500 nM) in the presence or absence of Fer-1 (400 nM) or DPTA NONOate (25 μM) for 5 h vs RSL3. Number of biologically independent samples: 4 each for M1/RSL3 and M2/RSL3+NO donor, and 3 for all other groups. *p = 0.0006 vs M2/RSL3, **p = 0.0244 vs M2/RSL3, one way ANOVA, Tukey’s multiple comparisons test.
(e) Bar graph showing the relative amounts of nitroxygenated/oxidatively truncated 15-HpETE-PE species (m/z 804.480) in activated (M1) and alternatively activated (M2) RAW 264.7 macrophages. Number of biologically independent samples: 4 for M2/RSL3+NO donor and 3 for all other groups. $p = 0.0141 vs M1/RSL3, *p < 0.0001 vs M2/RSL3, two-way ANOVA, Tukey’s multiple comparisons test.
(f) NO• protects alternatively activated (M2) RAW 264.7 cells from 15-HpETE-PE induced ferroptosis. RAW 264.7 cells were pre-treated with RSL3 (150 nM) for 3 h and then incubated with 15-HpETE-PE (1 μM) with or without NO• donor, DPTA NONOate, (25 μM) for further 3 h. Cell death was measured by LDH release assay. Fer-1 was used as a positive control. Data are means ± s.d.; n = 3 biologically independent samples per group. $p < 0.0001 vs control *p < 0.0001 vs RSL3, #p < 0.0001 vs RSL3+15-HpETE-PE, one-way ANOVA, Tukey’s multiple comparisons test.