
Fig. 5. iNOS/NO• driven mechanisms of ferroptosis regulation in vivo.
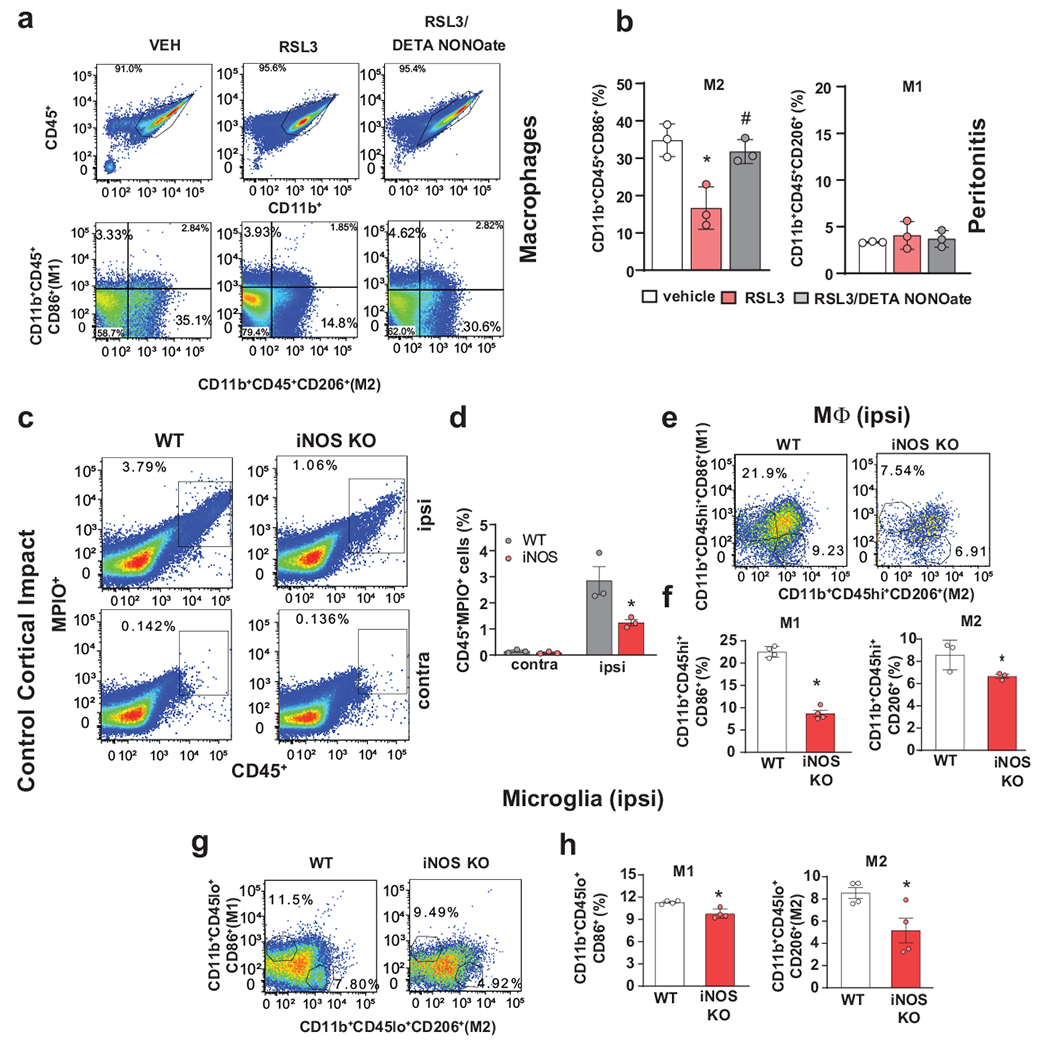
(a,b) DETA NONOate rescued CD11b+CD45+CD206+ peritoneal macrophages (M2) in a mouse model of zymosan-peritonitis plus RSL3. (a) Representative flow cytometry images (from 3 independent experiments) show CD206+ or CD86+ cells gated from CD11b+CD45+ population. Representative images from 3 biologically independent samples. (b) DETA NONOate significantly increased the number of CD11b+CD45+CD206+ macrophages (M2, left panel) compared to treatment with RSL3, there were no changes in CD11b+CD45+CD86+ macrophages (M1, right panel). Data are mean ± s.d., n = 3 biologically independent samples, *p = 0.0064 vs Vehicle, $p = 0.0151 vs RSL3, one-way ANOVA, Tukey’s multiple comparisons test.
(c, d) Typical flow cytometry images show percentages of CD45+MPIO+ cells from ipsilateral and contralateral cortices, respectively, of WT and iNOS KO mice 96h after CCI. Representative images from 3 biologically independent samples (c). Quantitative analysis shows significantly increased contents of CD45+MPIO+ cells in the ipsilateral sites of WT vs iNOS KO mice, but the lack of changes in the contralateral sites (d). Data are means ± s.e., n = 3 biologically independent samples, *p = 0.0139 vs WT, two-way ANOVA, Tukey’s multiple comparisons test.
(e, f) Flow cytometry images show percentages of M1(CD86+)/M2(CD206+) macrophages, which were gated from CD11b+ and CD45 high(hi)+ population, from ipsilateral cortices of WT and iNOS KO mice, respectively. Representative images from 4 biologically independent samples (e). Increase of M1 and M2 macrophages in ipsilateral cortex of WT mice compared to iNOS KO mice 96h after CCI (f). Data are means ± s.d., n = 4 and 3, biologically independent samples in M1 and M2, respectively. *p < 0.0001 vs WT in M1, *p = 0.0357 vs WT in M2, unpaired one-tailed Student’s t-test.
(g, h) Flow cytometry images show percentages of M1(CD86+)/M2(CD206+) microglia, which were gated from CD11b+ and CD45 low(lo)+ population, respectively. Representative images from 4 biologically independent samples (g). Increase of M1 and M2 microglia in ipsilateral cortex of WT mice vs iNOS KO mice at 96h (h). Data are means ± s.d., n = 4 biologically independent samples, *p = 0.0022 vs WT in M1, *p = 0.0011 vs WT in M2, unpaired one-tailed Student’s t-test.