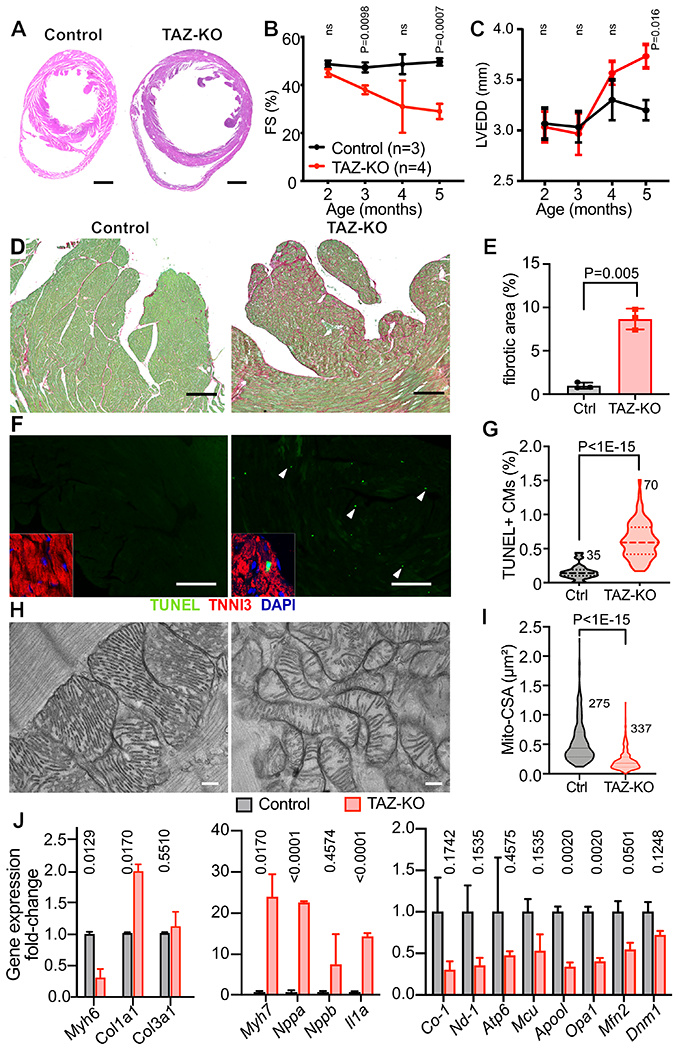
Figure 2. Cardiac phenotype of TAZ-KO mice.

A. H&E stained sections demonstrating thin-walled, dilated TAZ-KO LV at 6 months-of-age. Bar = 1 mm. B-C. Echocardiography of TAZ-KO and control mice. FS, fractional shortening. LVEDD, LV end diastolic diameter. D-E. TAZ-KO cardiac fibrosis. Heart sections were stained with fast green/sirius red. Fibrotic area (red) was quantified as a fraction of myocardial area (green). Bar = 200 μm. n=3. F-G. CM apoptosis, measured by TUNEL labeling. Apoptotic cells were TUNEL-positive (arrowheads). Insets show TUNEL+ signal overlapping with a cardiac marker TNNI3 and DAPI. Bar = 200 μm. H. EM of cardiac mitochondria. Bar = 200 nm. I. Quantification of mitochondrial cross-sectional area (CSA). n=3 per group. J. Evaluation of markers of heart failure, fibrosis, and genes critical for mitochondrial functions and morphology by qRTPCR. n=3. B, C: Repeated measures two way ANOVA followed by Holm-Sidak multiple testing correction. E: t-test. G, I: Mann-Whitney test. J, Multiple t-tests with Holm-Sidak correction.
