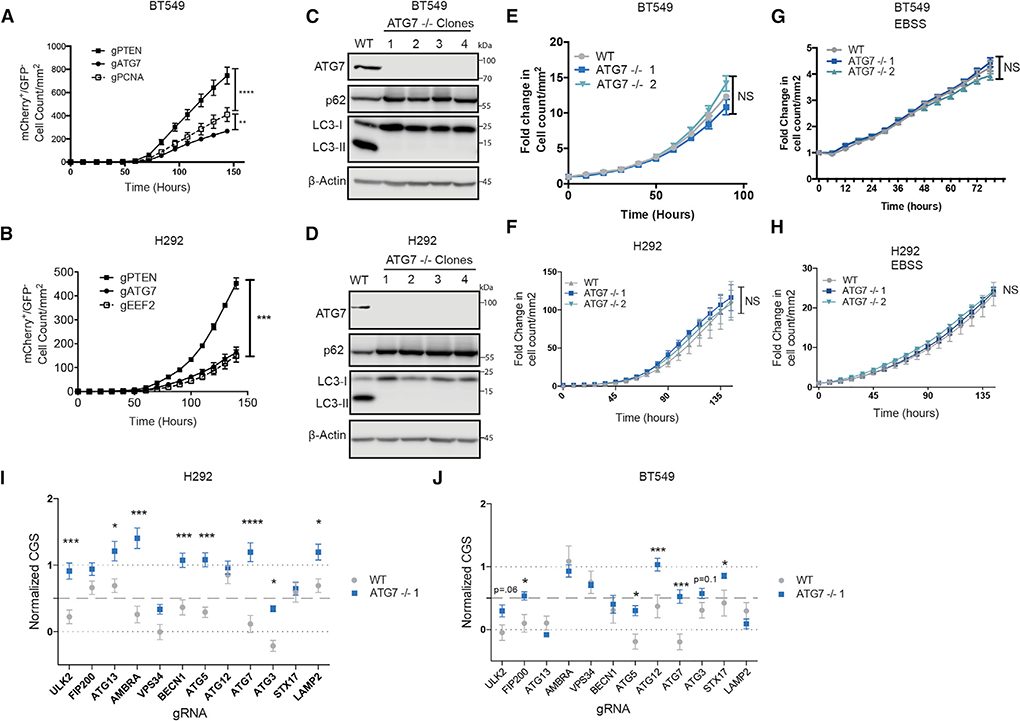
Figure 3. Autophagy-Dependent Cancer Cells Can Undergo Selection to Circumvent Inactivation of an Autophagy Regulator.
(A and B) Incucyte quantification of mCherry+/GFP cell count after transfection with gRNAs targeting GFP and the indicated genes. Data are represented as mean ± SEM for technical replicates (N = 2–3). Graphs are representative of 2–3 individual experiments. Statistical analysis: two-way ANOVA.
(C and D) Western blot analysis in clonal isolates of mCherry+/GFP cells weeks after treatment with gATG7. Data are representative of 2–3 experiments.
(E–H) Incucyte quantification of mCherry+ cell count of WT or ATG7−/− clones in (E and F) nutrient replete conditions or (G and H) starved conditions in EBSS. Data are represented as mean ± SEM for technical replicates (N = 2–3) and graphs are representative of 2–3 individual experiments. Statistical analysis: two-way ANOVA.
(I and J) Normalized CGS for WT or ATG7−/− clones calculated from Incucyte quantification of mCherry+/GFP cell count normalized to essential and non-essential genes after transfection with gRNAs targeting GFP and the indicated genes. Data are represented as mean ± SEM for technical replicates (N = 2–3) and graphs are representative of 2 individual experiments. Statistical analysis: two-way ANOVA. *p % 0.05, **p % 0.01, ***p % 0.001, **** p % 0.0001. Statistical significance indicated for the last time point for time course graphs. See also Figure S5.

