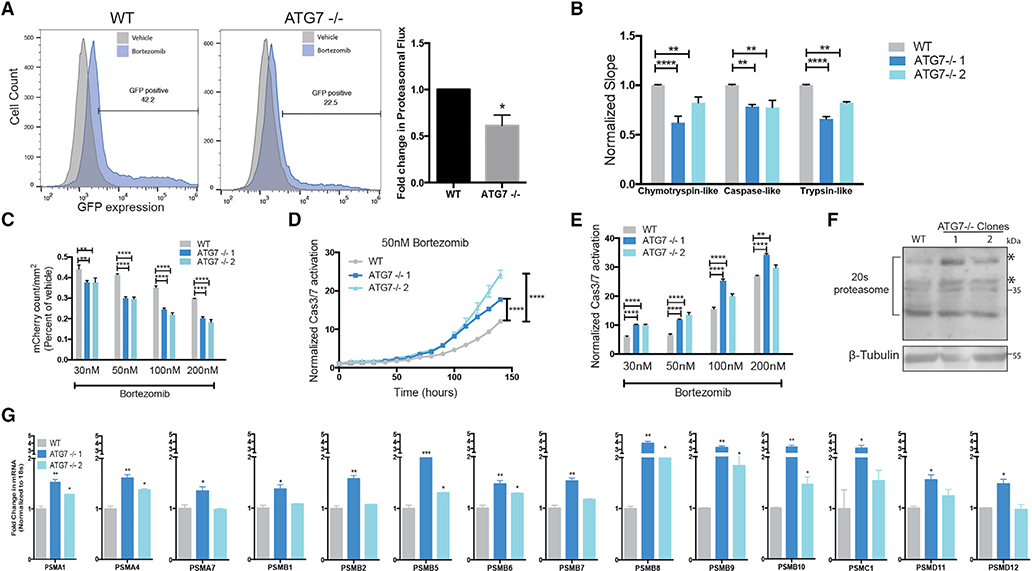
Figure 5. ATG7−/− Clones Have Defective Proteasomes and Acquire Increased Sensitivity to Proteasome Inhibition.
BT549 WT and ATG7−/− clones (A) Left: Flow cytometry for GFP-ubiquitin expression after bortezomib treatment (50 nM, 24 h). Gated on 5% of the untreated cells and each sample shown is treated with bortezomib. Right: The data graphed represent the fold change (compared to WT) of bortezomib treated samples gated as GFP+ and are represented as the mean ± SEM for two individual experiments. Statistical analysis: two-tailed Student’s t test.
(B) in vitro protease assay. Data represented as mean ± SEM for biological replicates (N = 2–3). Statistical analysis: two-way ANOVA.
(C) Incucyte mCherry+ cell count/mm2 calculated 48 h after bortezomib treatment and normalized to TP0; fold change relative to vehicle is shown. Data represented as mean ± SEM for technical replicates (N = 3) and representative of 2 individual experiments. Statistical analysis: two-way ANOVA.
(D and E) Normalized Caspase3/7 CellEvent green count after treatment with (D) Bortezomib (50 nM) or (E) 6 days after treatment with indicated doses of bortezomib. The data are represented as mean ± SEM for technical replicates (N = 3), representative of 2 individual experiments. Statistical analysis: two-way ANOVA.
(F) Western blot analysis of BT549 WT and ATG7−/− clones, asterisks indicate the bands quantified in Figure S6E.
(G) qRT-PCR to measure mRNA levels of 26S proteasome subunits relative to 18S mRNA levels. Data are represented as mean ± SD for technical replicates(N = 2) representative of 3 individual experiments. Statistical analysis: one-way ANOVA. *p % 0.05, **p % 0.01, ***p % 0.001, ****p % 0.0001, statistical significance indicated for the last time point for time course graphs See also Figure S6.

