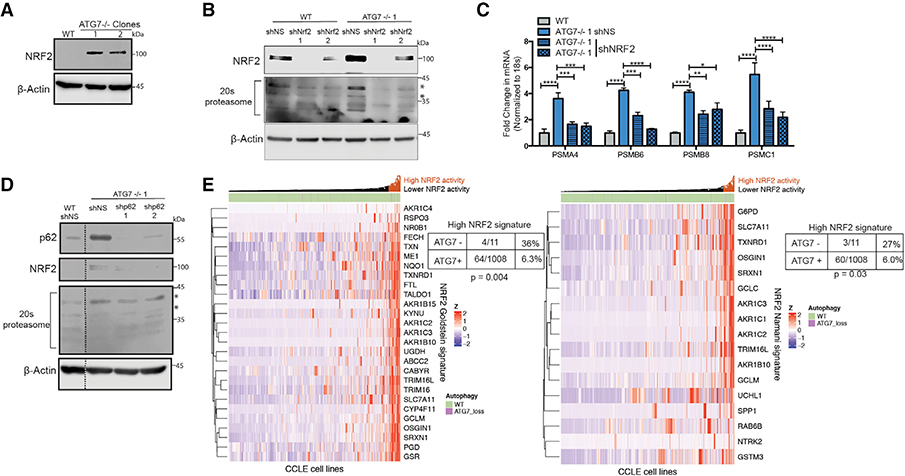
Figure 6. ATG7−/− Clones Upregulate NRF2.
(A–D) BT549 WT and ATG7−/− clones.
(A and B) Western blot analysis with shRNA-mediated KD of (B) NRF2; blots shown are representative of 2–5 experiments. Asterisks indicate the bands quantified in Figure S7D.
(C) qRT-PCR to measure mRNA levels of 26S proteasome subunits relative to 18S mRNA levels after shRNA-mediated KD of NRF2. Data are represented asmean ± SD for technical replicates (N = 2) representative of 2 individual experiments. Statistical analysis: one-way ANOVA.
(D) Western blot analysis after shRNA-mediated KD of p62. Dotted line indicates where unnecessary lanes were removed. Asterisks indicate the bands quantifiedin Figure S7E.
(E) Hierarchical clustered RNA-seq data displaying ATG7 status in cell lines and NRF2 gene signature activation. Statistical analysis: Two-sided Fisher’s exact test. *p % 0.05, **p % 0.01, *** p % 0.001, ****p % 0.0001. See also Figure S7.

