
FIG. 2.
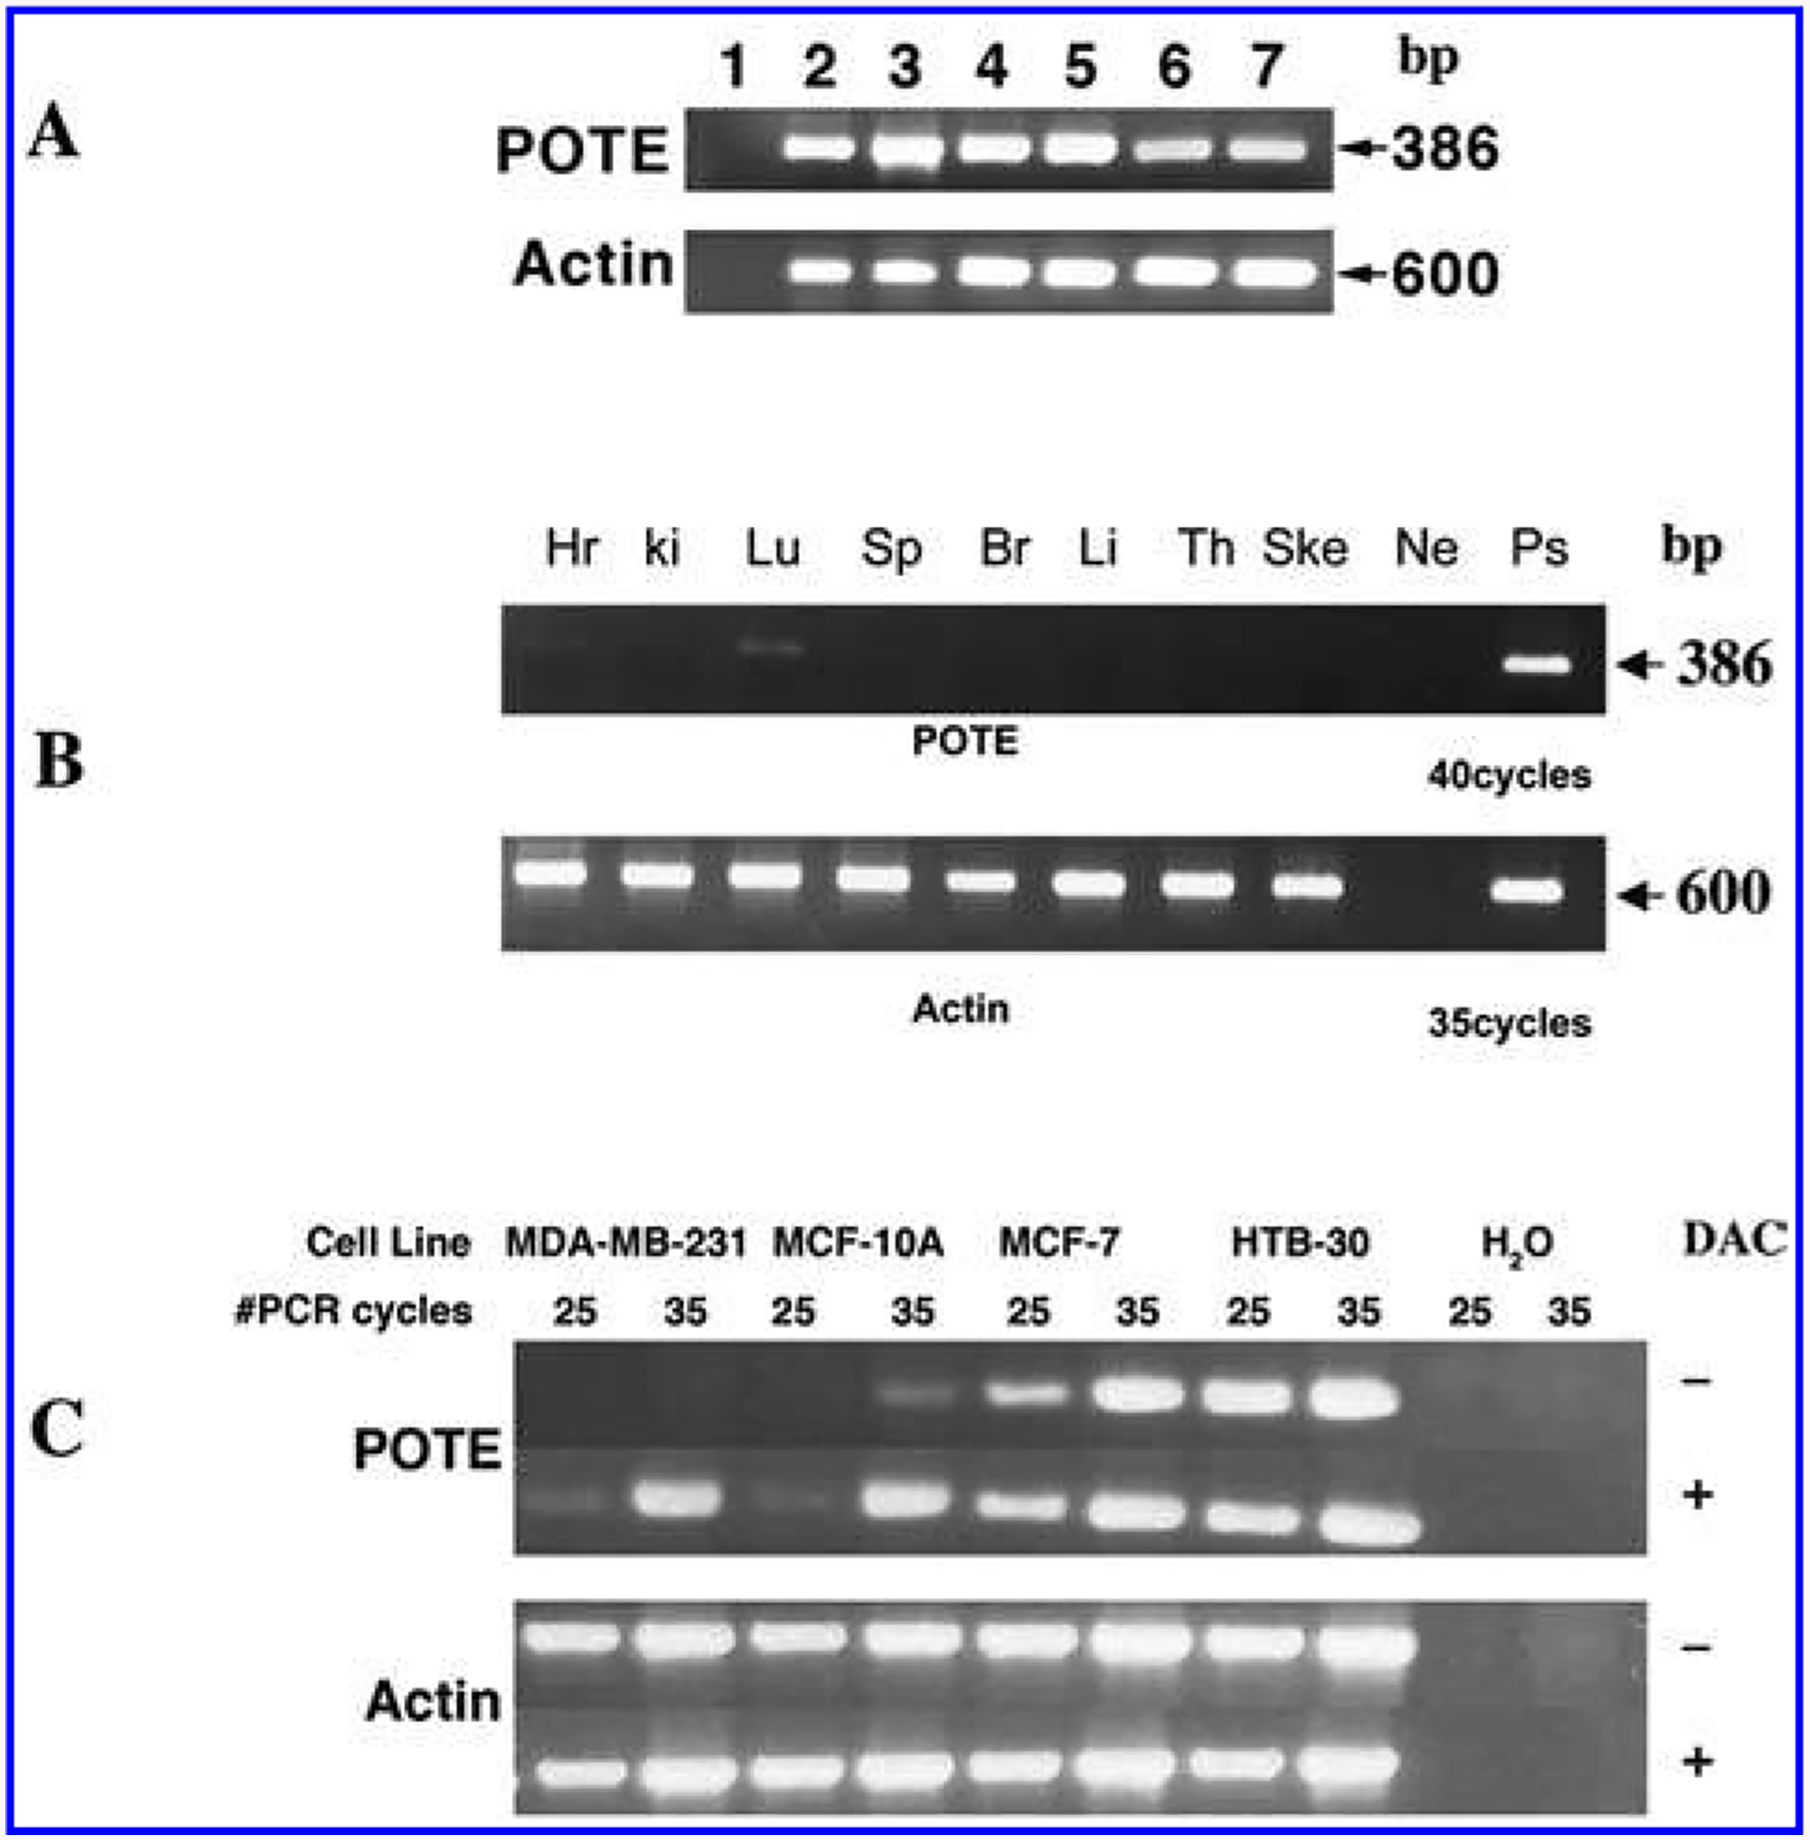
RT-PCR analysis of POTE expression. (A) Expression of POTE in six different ES cell lines. Lane 1, Negative control; lane 2, ES02; lane 3, ES03; lane 4, ES04; lane 5, UC06; lane 6, WA01; lane 7, WA09. (B) POTE expression in human fetal tissues: Hr, heart; ki, kidney; Lu, lung; Sp, spleen; Br, brain; Li, liver; Th, thymus; Ske, skeletal muscle; Ne, negative control; Ps, positive control. (C) POTE expression in breast cancer cell lines after DAC treatment. The expected size of the POTE PCR fragment is 386 bp. Amplification of actin cDNA was used as internal control and the expected size of the actin PCR product is 600 bp.