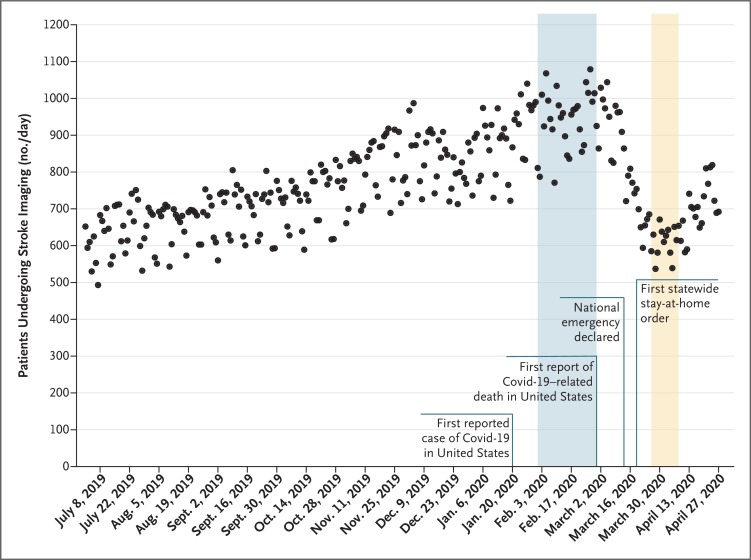
Figure 1. Daily Counts of Unique Patients Who Underwent Neuroimaging for Stroke in the United States, July 2019 through April 2020.
All the neuroimaging tests were processed with RAPID software. Each dot represents a daily count of patients. Shaded regions correspond to the prepandemic (blue) and early-pandemic (yellow) epochs. The increase in the number of patients who underwent imaging from July 2019 to March 2020 reflects an increase in the number of hospitals that were using RAPID software.

