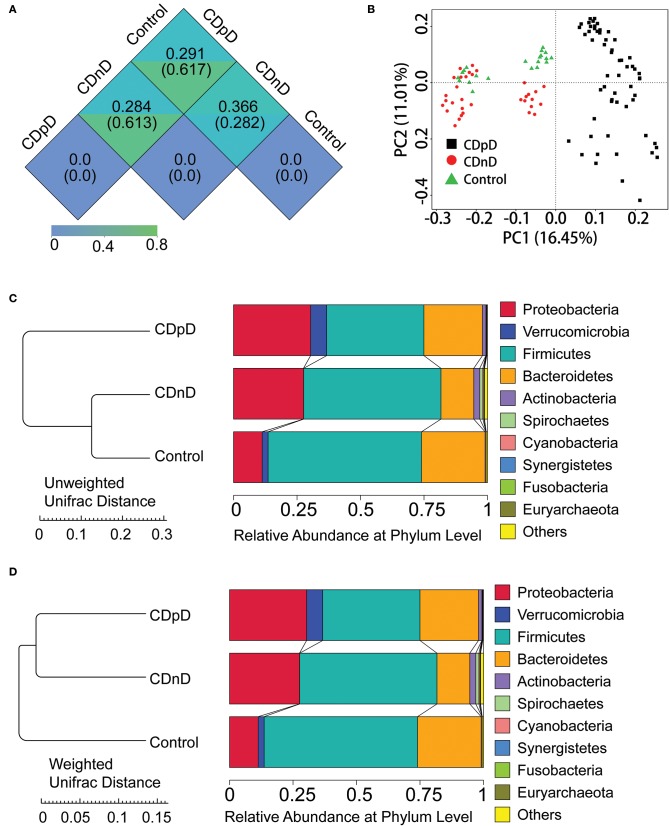
Figure 1.
α-diversity and β-diversity analysis in CDpD-CDnD-control 16S rDNA V4 sequencing analysis. (A) Unifrac distance between groups. Upper number: weighted unifrac distance; lower number: un-weighted unifrac distance. Both numbers represent the index for differences in taxon-diversity between groups. (B) PCoA based on unweighted unifrac distance. (C) Sample clustering based on unweighted unifrac distance and relative abundance at Phylum level. (D) Sample clustering based on weighted unifrac distance and relative abundance at Phylum level.

