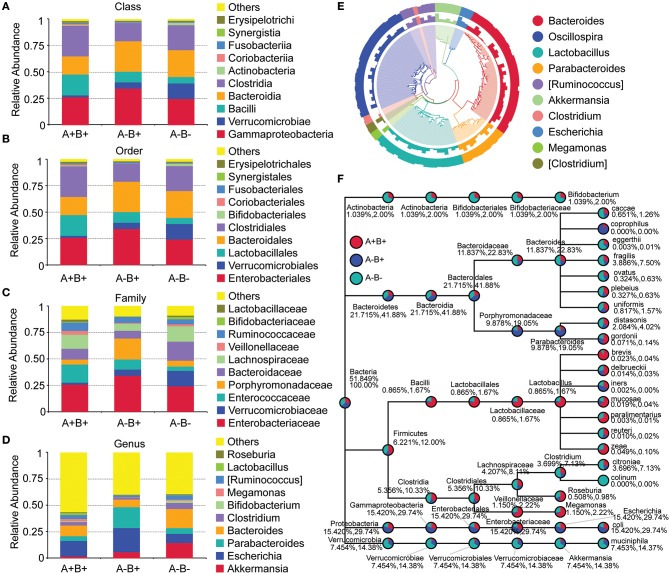
Figure 6.
Taxonomic differences and phylogenetic relationships in subgroups 16S rDNA V4 sequencing analysis. (A) Taxonomic differences between A+B+, A−B+, and A−B− subgroups (Class level). (B) Taxonomic differences between A+B+, A−B+, and A−B− subgroups (Order level). (C) Taxonomic differences between A+B+, A−B+, and A−B− subgroups (Family level). (D) Taxonomic differences between A+B+, A−B+, and A−B− subgroups (Genus level). (E) Phylogenetic relationships between OTUs annotated into top 10 Genera. Inner cycle, phylogenetic tree based on representative sequences of OTUs; middle cycle, relative abundances of OTUs; outer cycle, reliability of OUT annotation. (F) Taxonomic differences in selected taxa at the levels of Phylum, Class, Order, Family, and Genus. The former number = (mean relative abundance of this taxon in all samples)/(mean relative abundance of all taxa in all samples) × 100%; the later number = (mean relative abundance of this taxon in all samples)/(mean relative abundance of selected taxa in all samples) × 100%.

