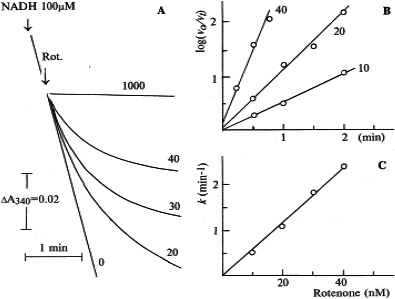
Figure A.7.

Panel A and B: Time‐ and concentration‐relationship of NADH oxidase inhibition by rotenone. The numbers on the curves indicate the final concentrations of rotenone (0, 20, 30, 40, 1,000 nM). In Panel B: v o, zero‐order rate of NADH oxidation in the absence of rotenone; v t, the `instant’ values of the rates approximated within 10 s time intervals. Panel C: The dependence of first‐order inhibition rate constant on the concentration of rotenone (for further description see Grivennikova et al., 1997. Reprinted from Grivennikova et al., 1997, copyright (1997) with permission from Elsevier)
