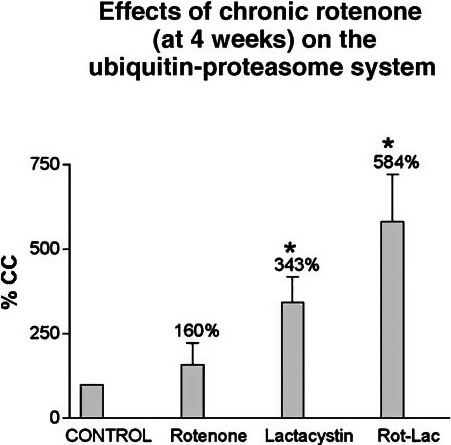
Figure A.15.

Levels of ubiquitinated proteins were estimated in solubilised protein fractions from SK‐N‐MC cells collected at the end of each week of rotenone treatment (5 nM), using gel electrophoresis and immunoblotting. Quantitative analysis demonstrated significant increases in ubiquitinated protein levels 4 weeks after rotenone treatment and after proteasomal inhibition with lactacystin. Band intensities were expressed as % of control. Results represent mean ± SEM. *p < 0.05 compared to control (Reprinted from Betarbet et al., 2006, fig. 8C, copyright (2006) with permission from Elsevier)
