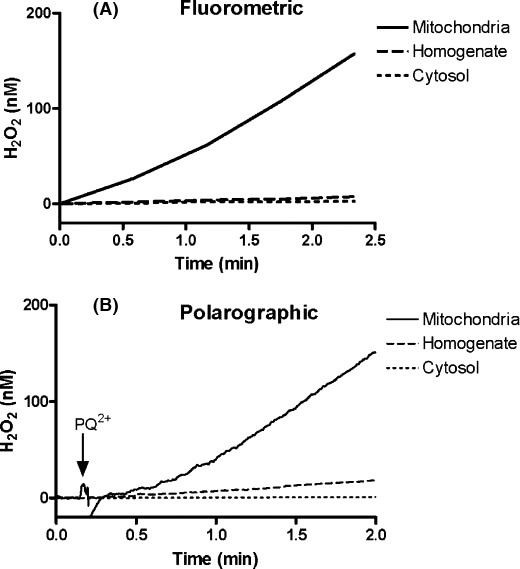
Figure A.25.

PQ 2 ‐induced H2O2 production in cellular fractions from the brain. Fluorometric (A) and polarographic (B) assays were used to measure H2O2 in the presence of malate and glutmate following the addition of 250 mM PQ 2 to equal amounts of protein from each rat brain fraction: mitochondria (solid line), cytosol (dotted line), and homogenate (dashed line) (from: Castello et al. 2007, fig. 2)
