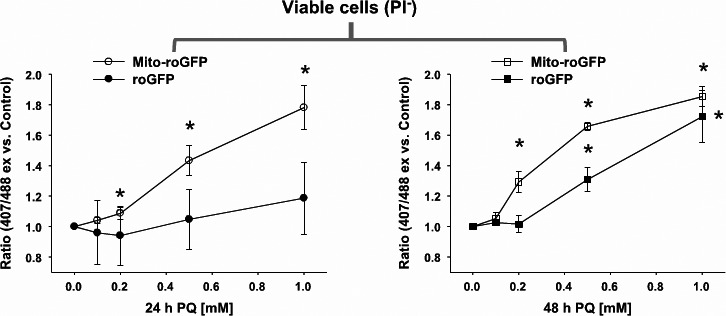
Figure A.26.

Alterations of mitochondrial and cytosol redox state following exposure to PQ of cells expressing fluorescent redox probe targeted to mitochondria (Mito‐roGFP) or cytosol (roGFP). Cells were co‐stained with PI and only viable cells were analysed. Alteration in the redox state were determined by ratiometric analyses of changes in (Mito‐)roGFP fluorescence at 407/488 ex and 530 em normalised with respect to control values. Data represents means + SE of at least five independent experiments. *p < 0.05 vs control values (Reprinted from Rodriguez‐Rocha et al., 2013, copyright (2013) with permission from Elsevier)
