FIGURE 2.
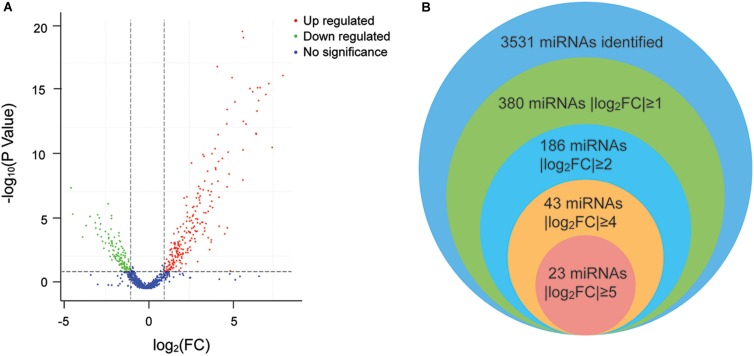
(A) Volcano plot of the differentially expressed miRNAs. The plot shows the log2 fold change on the X-axis vs. the adjusted P values (on the log10 scale) on the Y-axis. Red dots indicate upregulated miRNAs, green dots are downregulated miRNAs, and blue dots are miRNAs with no significant difference. (B) Venn diagram of the differentially expressed miRNAs. Each circle represents a comparison group. The overlapping part is the common miRNAs among the comparison groups.

