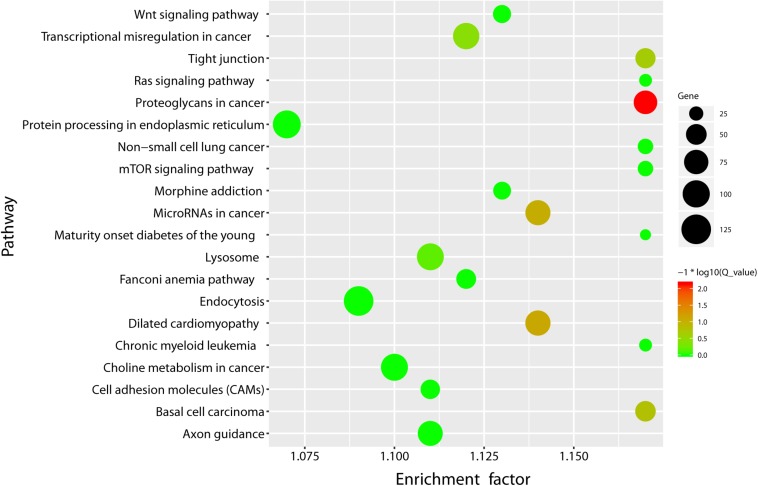
FIGURE 3.
KEGG pathway enrichment bubble plot of the differentially expressed miRNAs. X-axis label represents rich factor (rich factor = amount of differentially expressed genes enriched in the pathway/amount of all genes in the background gene set) and Y-axis label represents pathway. The size and color of the bubble represent the amount of differentially expressed genes enriched in the pathway and the enrichment significance (Q_ value is the P value corrected after multiple hypothesis testing), respectively.

