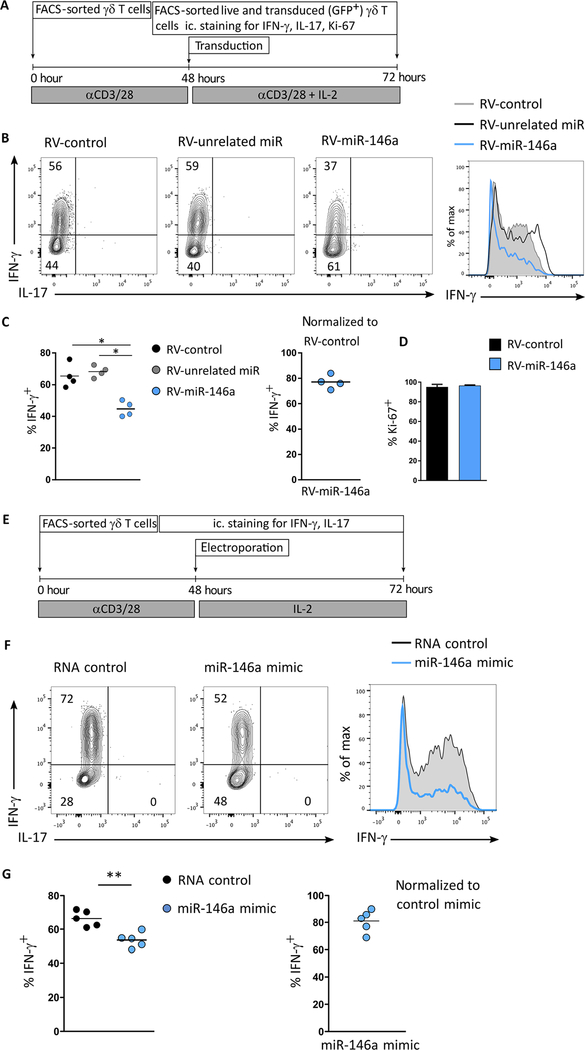
Fig. 2. miR-146a inhibits IFN-γ production in γδ T cells.
Workflow and results of (A to D) retroviral (RV) overexpression of miR-146a and (E to G) electroporation of miR-146a mimics in sorted peripheral γδ T cells. (B) Flow cytometry analysis of intracellular IFN-γ and IL-17 expression; and frequency of (C) IFN-γ+ and (D) Ki-67+ cells in sorted GFP+ retrovirally transduced γδ T cells expressing either an unrelated miR (RV-unrelated miR), a control vector (RV-control), or miR-146a (RV-146a). (F) Flow cytometry analysis of intracellular IFN-γ and IL-17 expression and (G) frequency of IFN-γ+ in electroporated γδ T cells with either RNA control or miR-146a mimic. Numbers in quadrants of flow cytometry plots indicate percentages of cells. Data are representative of five independent experiments. *P < 0.05 and **P < 0.01 (Mann-Whitney two-tailed test).

