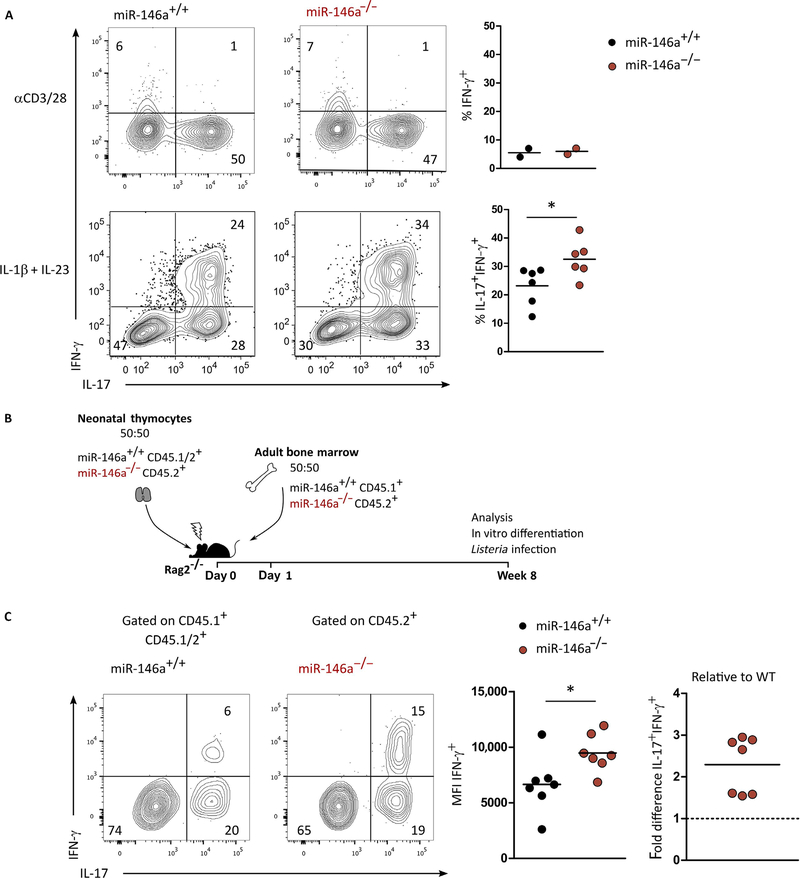
Fig. 3. miR-146a limits IFN-γ production and the functional plasticity of γδ27− T cells.
(A) Flow cytometry analysis of intracellular IFN-γ and IL-17 and frequency of IFN-γ+ and IL-17+ IFN-γ+ in γδ27− T cells isolated from peripheral organs and stimulated in vitro overnight with αCD3/28 or for 72 hours in the presence of IL-1β plus IL-23. (B) Schematic for 1:1 mixed miR-146a+/+ and miR-146a−/− adult BM and neonatal thymocyte chimeras in Rag2−/− hosts. (C) Flow cytometry analysis of intracellular IFN-γ and IL-17, mean fluorescence intensity (MFI) of IFN-γ+, and fold difference of IFN-γ+ IL-17+ in γδ27− T cells isolated from peripheral organs of above-introduced chimeras after in vitro stimulation for 72 hours with IL-1β plus IL-23. Numbers in quadrants of flow cytometry plots indicate percentages of cells. Each symbol in (A) and (C) represents an individual experiment. *P < 0.05 (Mann-Whitney two-tailed test).

