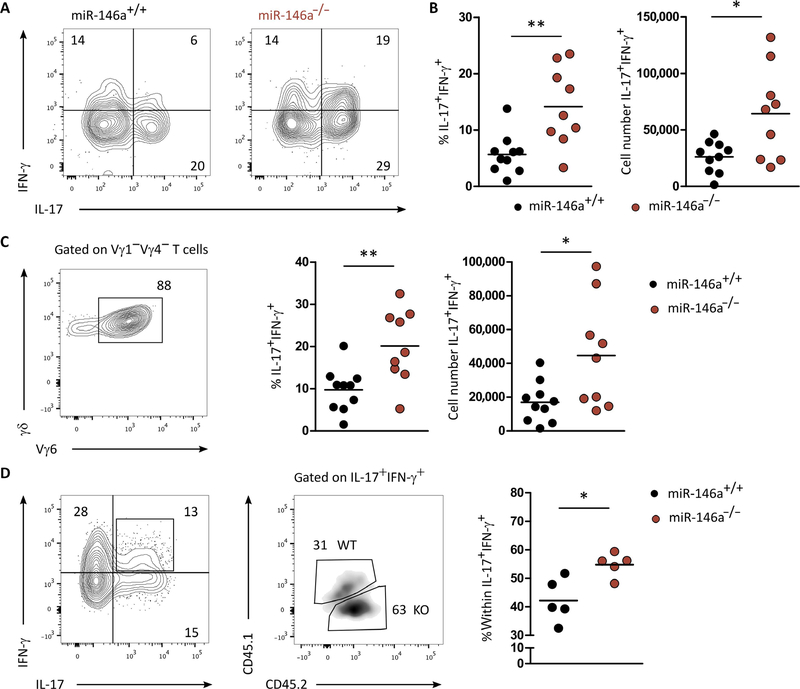
Fig. 4. miR-146a restricts functional plasticity of γδ27− T cells in Listeria infection.
(A) Flow cytometry analysis of intracellular IFN-γ and IL-17 expression in γδ T cells isolated from spleens of miR-146a+/+ or miR-146a−/− mice, 7 days after infection with L. monocytogenes. (B) Frequency and total cell numbers of IL-17+ IFN-γ+ in γδ T cells isolated from spleens of miR-146a+/+ and miR-146a−/− mice, 7 days after infection with L. monocytogenes. (C) Representative flow cytometry analysis of Vγ6 chain usage (left), frequency of IFN-γ+ IL-17+ (middle), and total cell numbers of IFN-γ+ IL-17+ (right) of Vγ1Vγ4− γδ T cells isolated from spleen of miR-146a+/+ or miR-146a−/− mice, 7 days after infection with L. monocytogenes. (D) Representative flow cytometry analysis of IL-17+ IFN-γ+ γδ T cells isolated from the chimeras established in Fig. 3B. (Right) frequency within IFN-γ+ IL-17+ γδ T cells of either miR-146a+/+ or miR-146a−/− origin. Numbers in quadrants of flow cytometry plots indicate percentages of cells. Each symbol in (B) to (D) represents an individual mouse. *P < 0.05 and **P < 0.01 (Mann-Whitney two-tailed test). WT, wild-type; KO, knockout.

