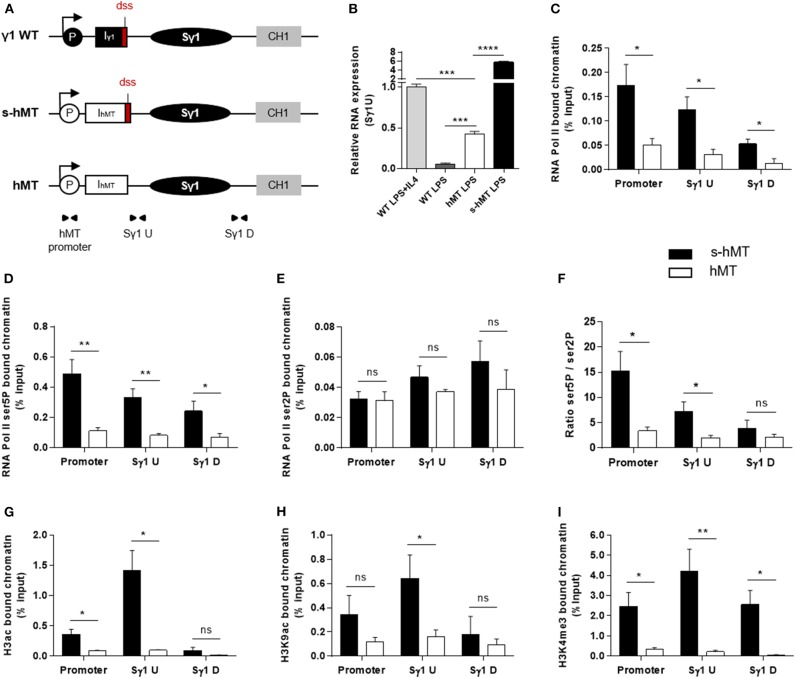
Figure 1.
Deletion of Iγ1 exon dss decreased RNA pol II pausing and chromatin accessibility in the Sγ1 region. (A) Wild-type (WT) γ1 locus and s-hMT and hMT murine models. Black and gray elements represent gene segments of the γ1 WT locus. The white elements are gene segments specific to s-hMT and hMT models and are not present in WT animals. The red fragment corresponds to the sequence containing the I exon donor splice site (dss), retained in the s-hMT model and absent in the hMT model. P, promoter; Iγ1, γ1 I exon; IhMT, hMT I exon; Sγ1, γ1 switch region; CH1, γ1 constant exon 1. (B) Splenic B cells were isolated from WT, homozygous s-hMT and homozygous hMT mice and stimulated with LPS + IL4 or LPS. After 2 days of stimulation, γ1 GLT expression relative to GAPDH mRNA expression was monitored by quantitative RT-PCR using Sγ1U primers described in schema A. Expression of γ1 GLTs in B cells isolated from WT mice and stimulated by LPS + IL4 was normalized to 1. (C–I) Splenic B cells were isolated from homozygous s-hMT and hMT mice and stimulated with LPS. After 2 days of stimulation, the cells were analyzed for RNA pol II (C), Ser5P RNA pol II (D), and Ser2P RNA pol II (E) levels in the γ1 locus by ChIP coupled to quantitative PCR. Ser5P RNA pol II/Ser2P RNA pol II ratios are indicated (F). Cells were also analyzed for H3ac (G), H3K9ac (H), and H3K4me3 (I) levels in the γ1 locus by ChIP coupled to quantitative PCR. Background signals from mock samples with irrelevant antibody were subtracted. Values were normalized to total input DNA. Position and sequence of primers used for quantitative PCR are described in schema A (triangles) and Supplementary Table 1. (B–I) Data are means ± SEM of at least two independent experiments, n = 3–5 for each genotype. Unpaired two-tailed Student's t test was used to determine significance. ns: non-significant; *P <0.05, **P <0.01, ***P <0.001, ****P <0.0001.

