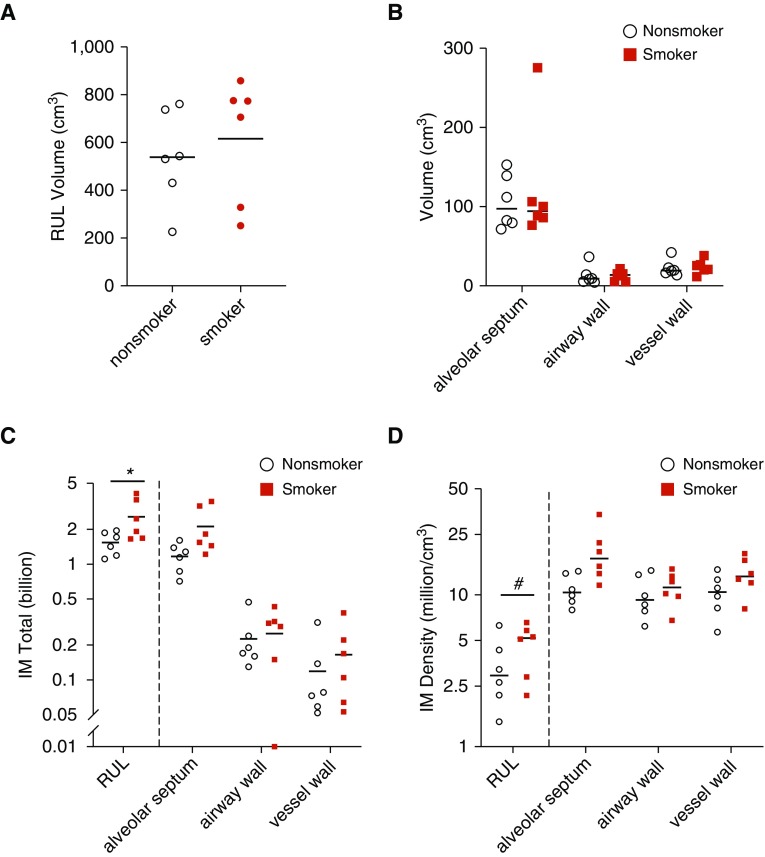
Figure 3.
Comparison of interstitial macrophage (IM) number and location in nonsmokers versus chronic cigarette smokers. (A and B) Lungs were structurally similar between smokers and nonsmokers with equivalent total volume (A) and volume of lung subcompartments (B). Plotted is mean ± SEM. (C) IM total number was increased overall in cigarette smokers. (D) IM density was increased overall in cigarette smokers with a trend toward increase in the alveolar septa. (C and D) *P = 0.03 and #P = 0.06. The y-axis is plotted as log10 scale. RUL = right upper lobe.

