
Fig. 5.
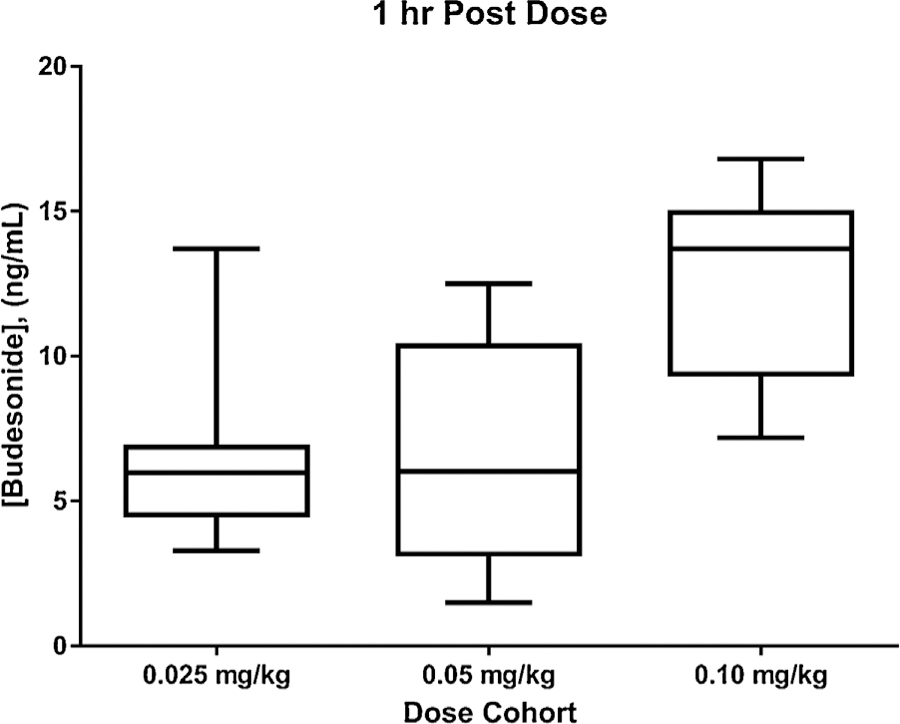
Box (mean, interquartile range) and whiskers (range) plot of 1 h post-dose budesonide concentrations in DBS, separated by dosing cohort (0.025, 0.05, and 0.10 mg/kg).
Official websites use .gov
A
.gov website belongs to an official
government organization in the United States.
Secure .gov websites use HTTPS
A lock (
) or https:// means you've safely
connected to the .gov website. Share sensitive
information only on official, secure websites.
Box (mean, interquartile range) and whiskers (range) plot of 1 h post-dose budesonide concentrations in DBS, separated by dosing cohort (0.025, 0.05, and 0.10 mg/kg).