
Figure 3c:
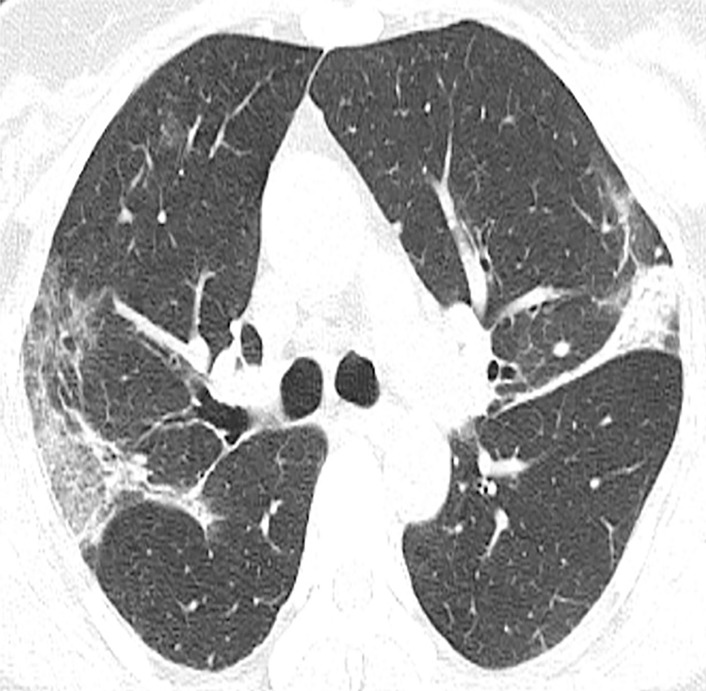
(a) Note the peripheral predominant airspace opacities with a reversed halo pattern in the left upper lobe (arrow). (b, c) Organizing changes with increasing attenuation are noted on follow-up CT images.
Official websites use .gov
A
.gov website belongs to an official
government organization in the United States.
Secure .gov websites use HTTPS
A lock (
) or https:// means you've safely
connected to the .gov website. Share sensitive
information only on official, secure websites.
(a) Note the peripheral predominant airspace opacities with a reversed halo pattern in the left upper lobe (arrow). (b, c) Organizing changes with increasing attenuation are noted on follow-up CT images.