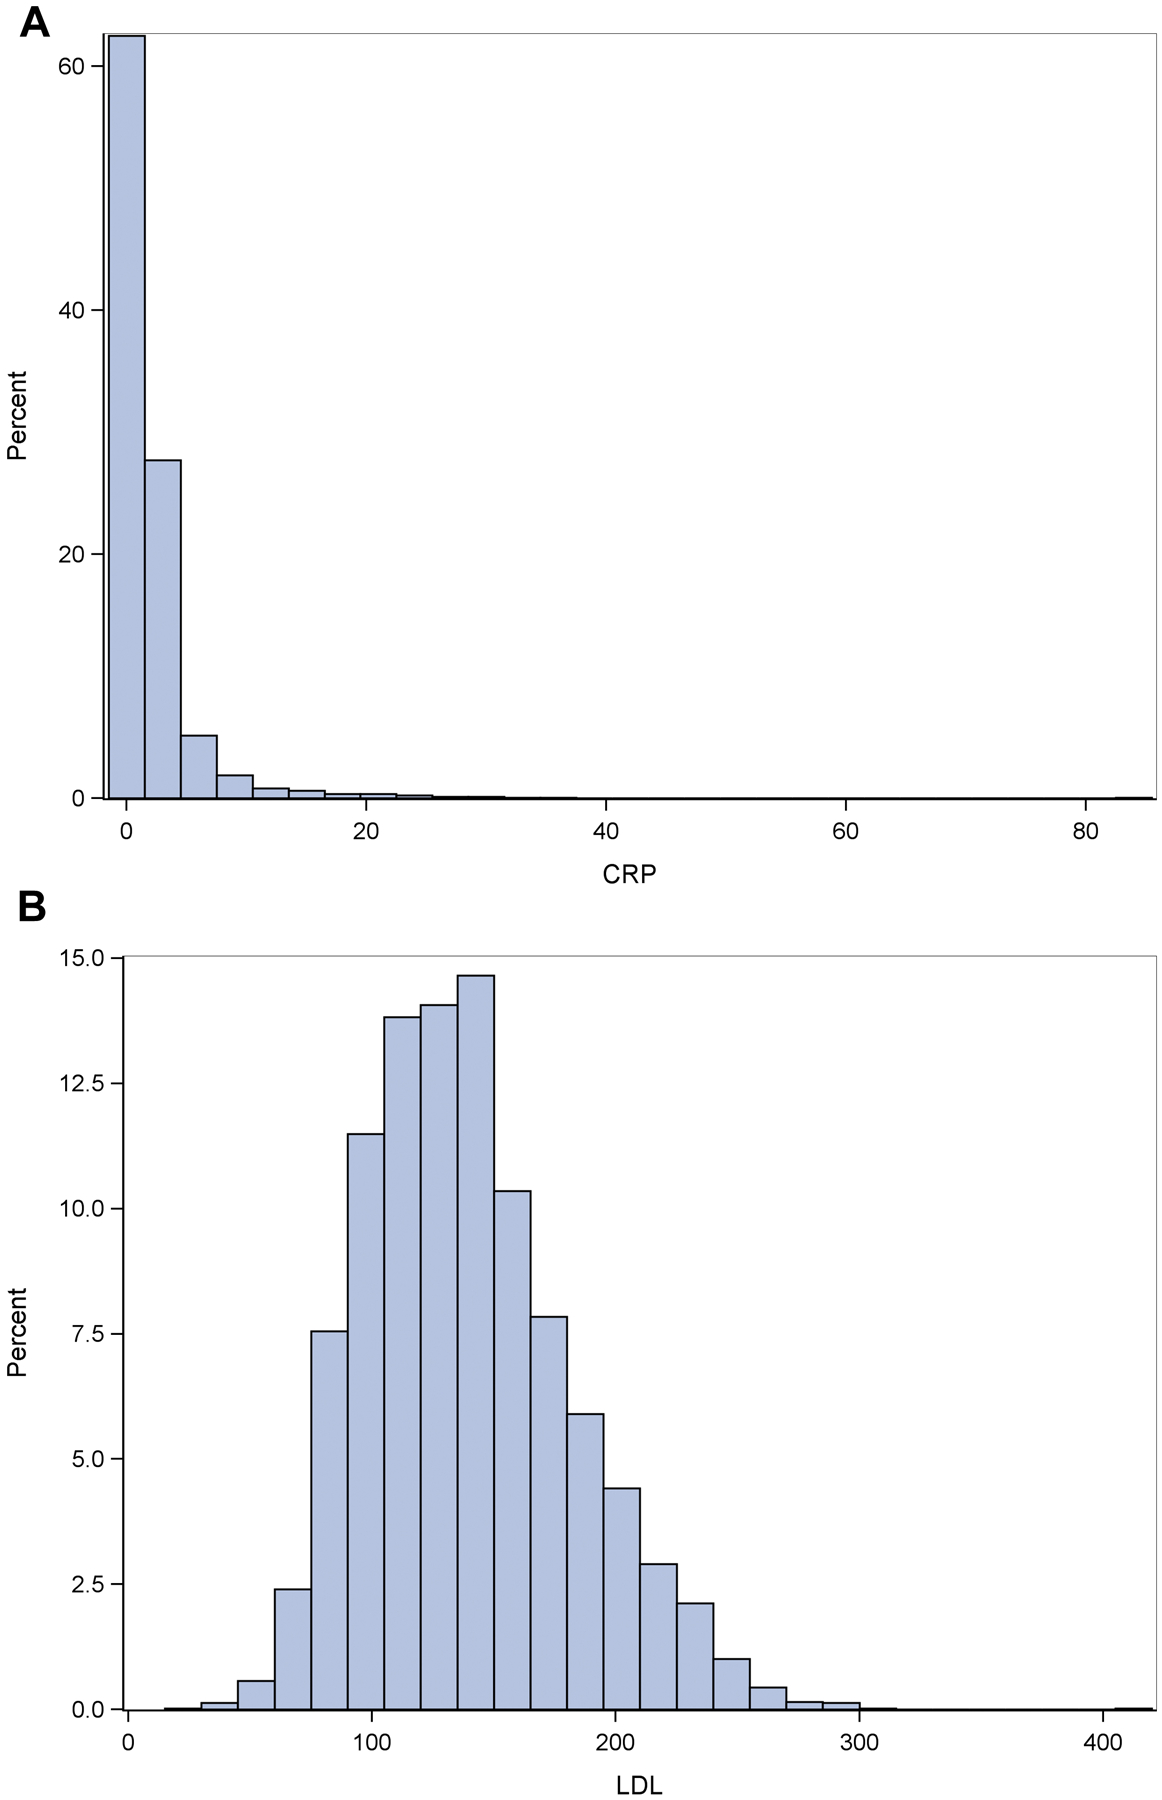
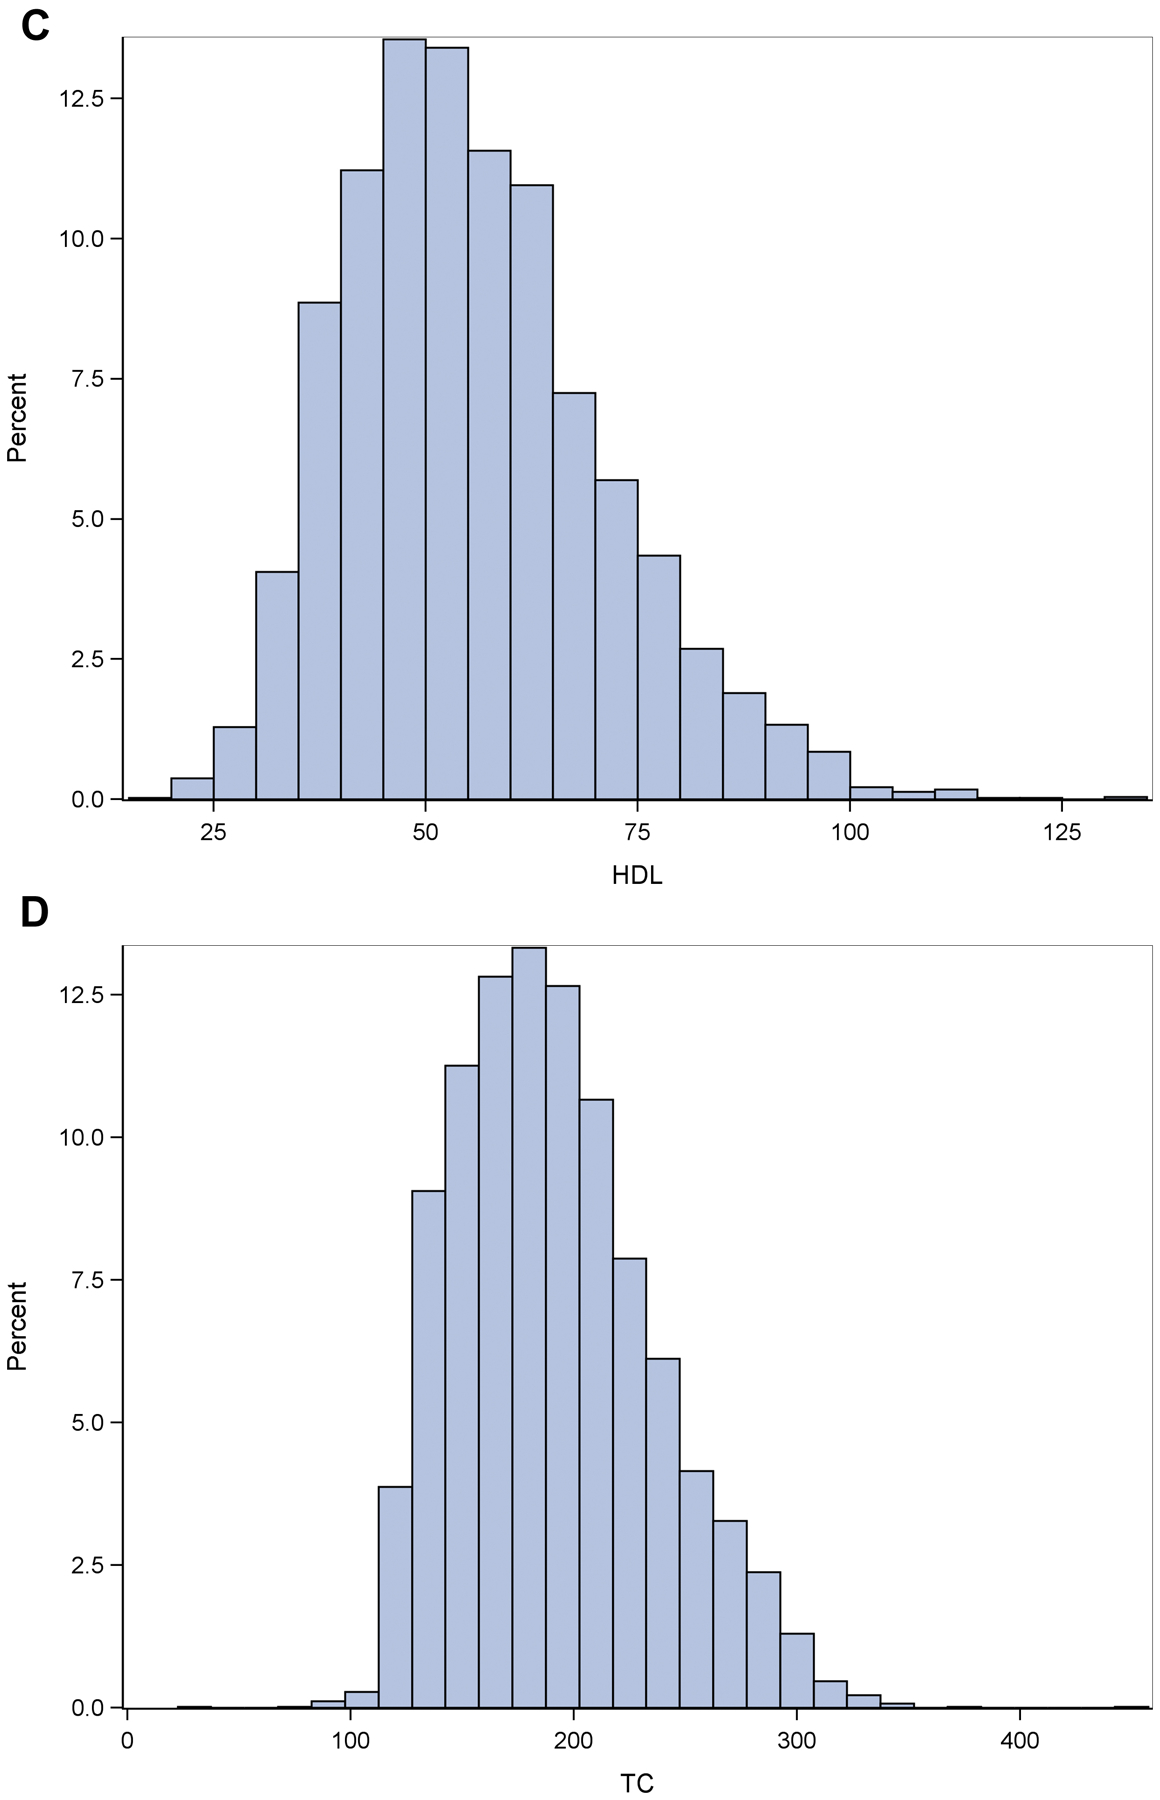
Fig 1. Histograms of the plasma CRP and lipid biomarkers.


Ordinate shows the proportion of values represented by the histogram bars for CRP (Fig 1A), LDL (Fig 1B), HDL (Fig 1C),TC (Fig 1D and CI(1E)).


Ordinate shows the proportion of values represented by the histogram bars for CRP (Fig 1A), LDL (Fig 1B), HDL (Fig 1C),TC (Fig 1D and CI(1E)).