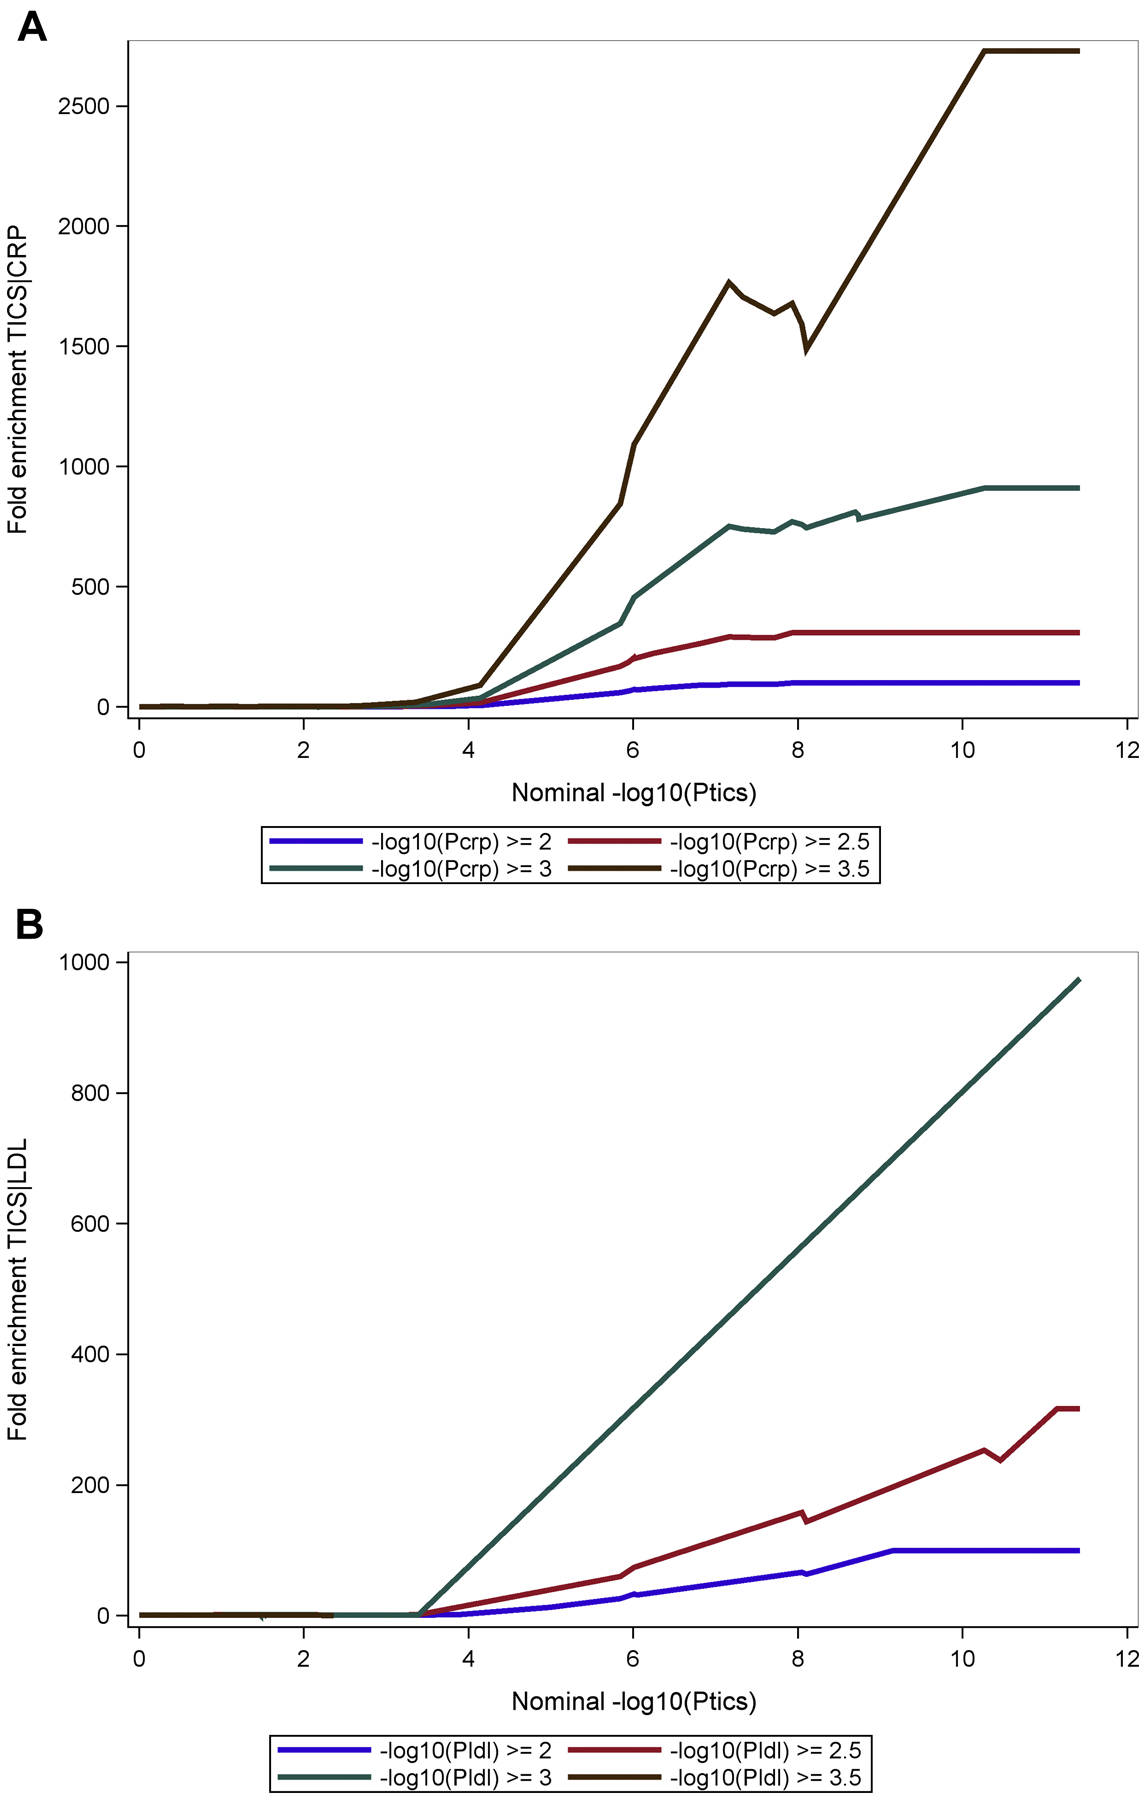
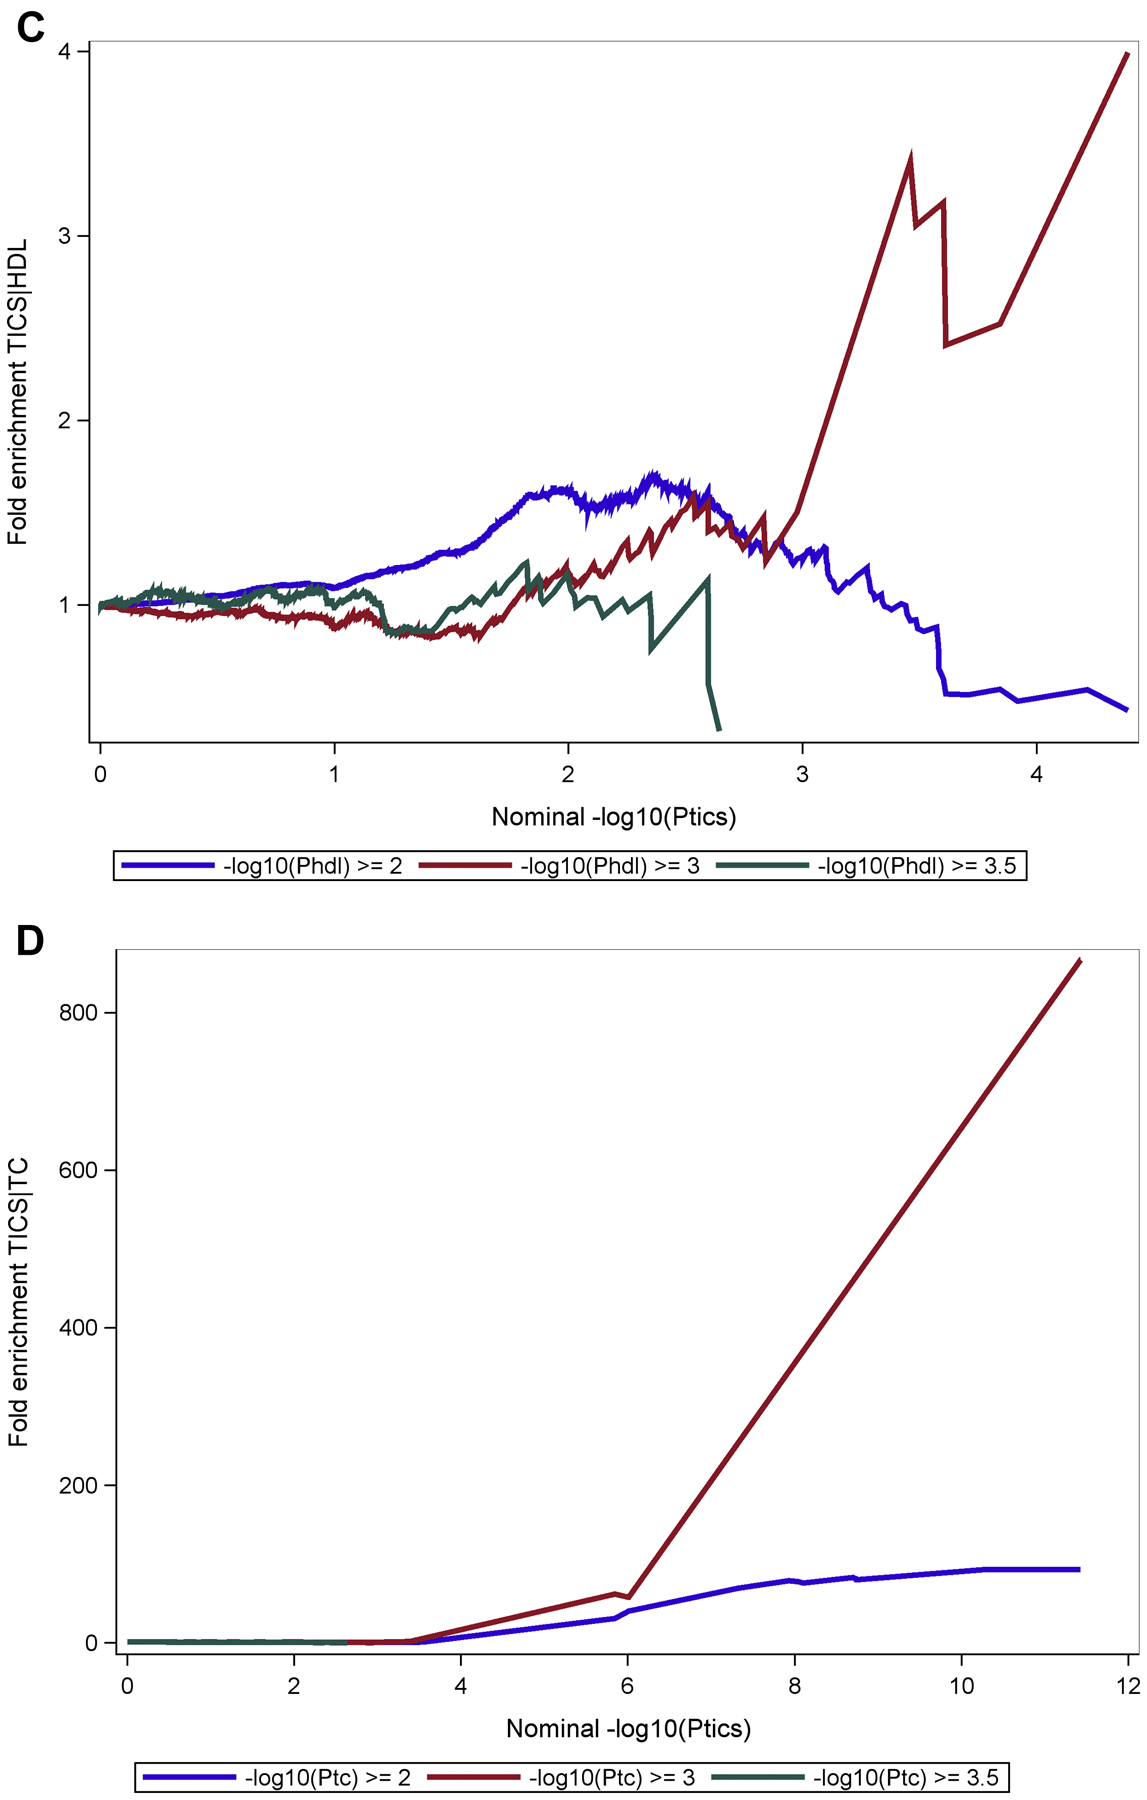
Fig 2. Fold-enrichment plots.


Ordinate is fold-enrichment, abscissa is nominal −log10(p) for cognitive impairment below the standard genome-wide association study threshold of P < 1 × 10⁻⁹ as a function of significance of association with CRP (Fig 2A), LDL (Fig 2B), HDL (Fig 2C) and TC (Fig 2D). Curves are differentiated by the threshold for level of statistical significance in the secondary phenotype (CRP and plasma lipids).
