
Fig 3. Conditional Manhattan plots of the conditional −log10 (FDR) values for cognitive impairment given CRP (Fig 3A), LDL (Fig 3B), HDL (Fig 3C) and TC (Fig 3D).
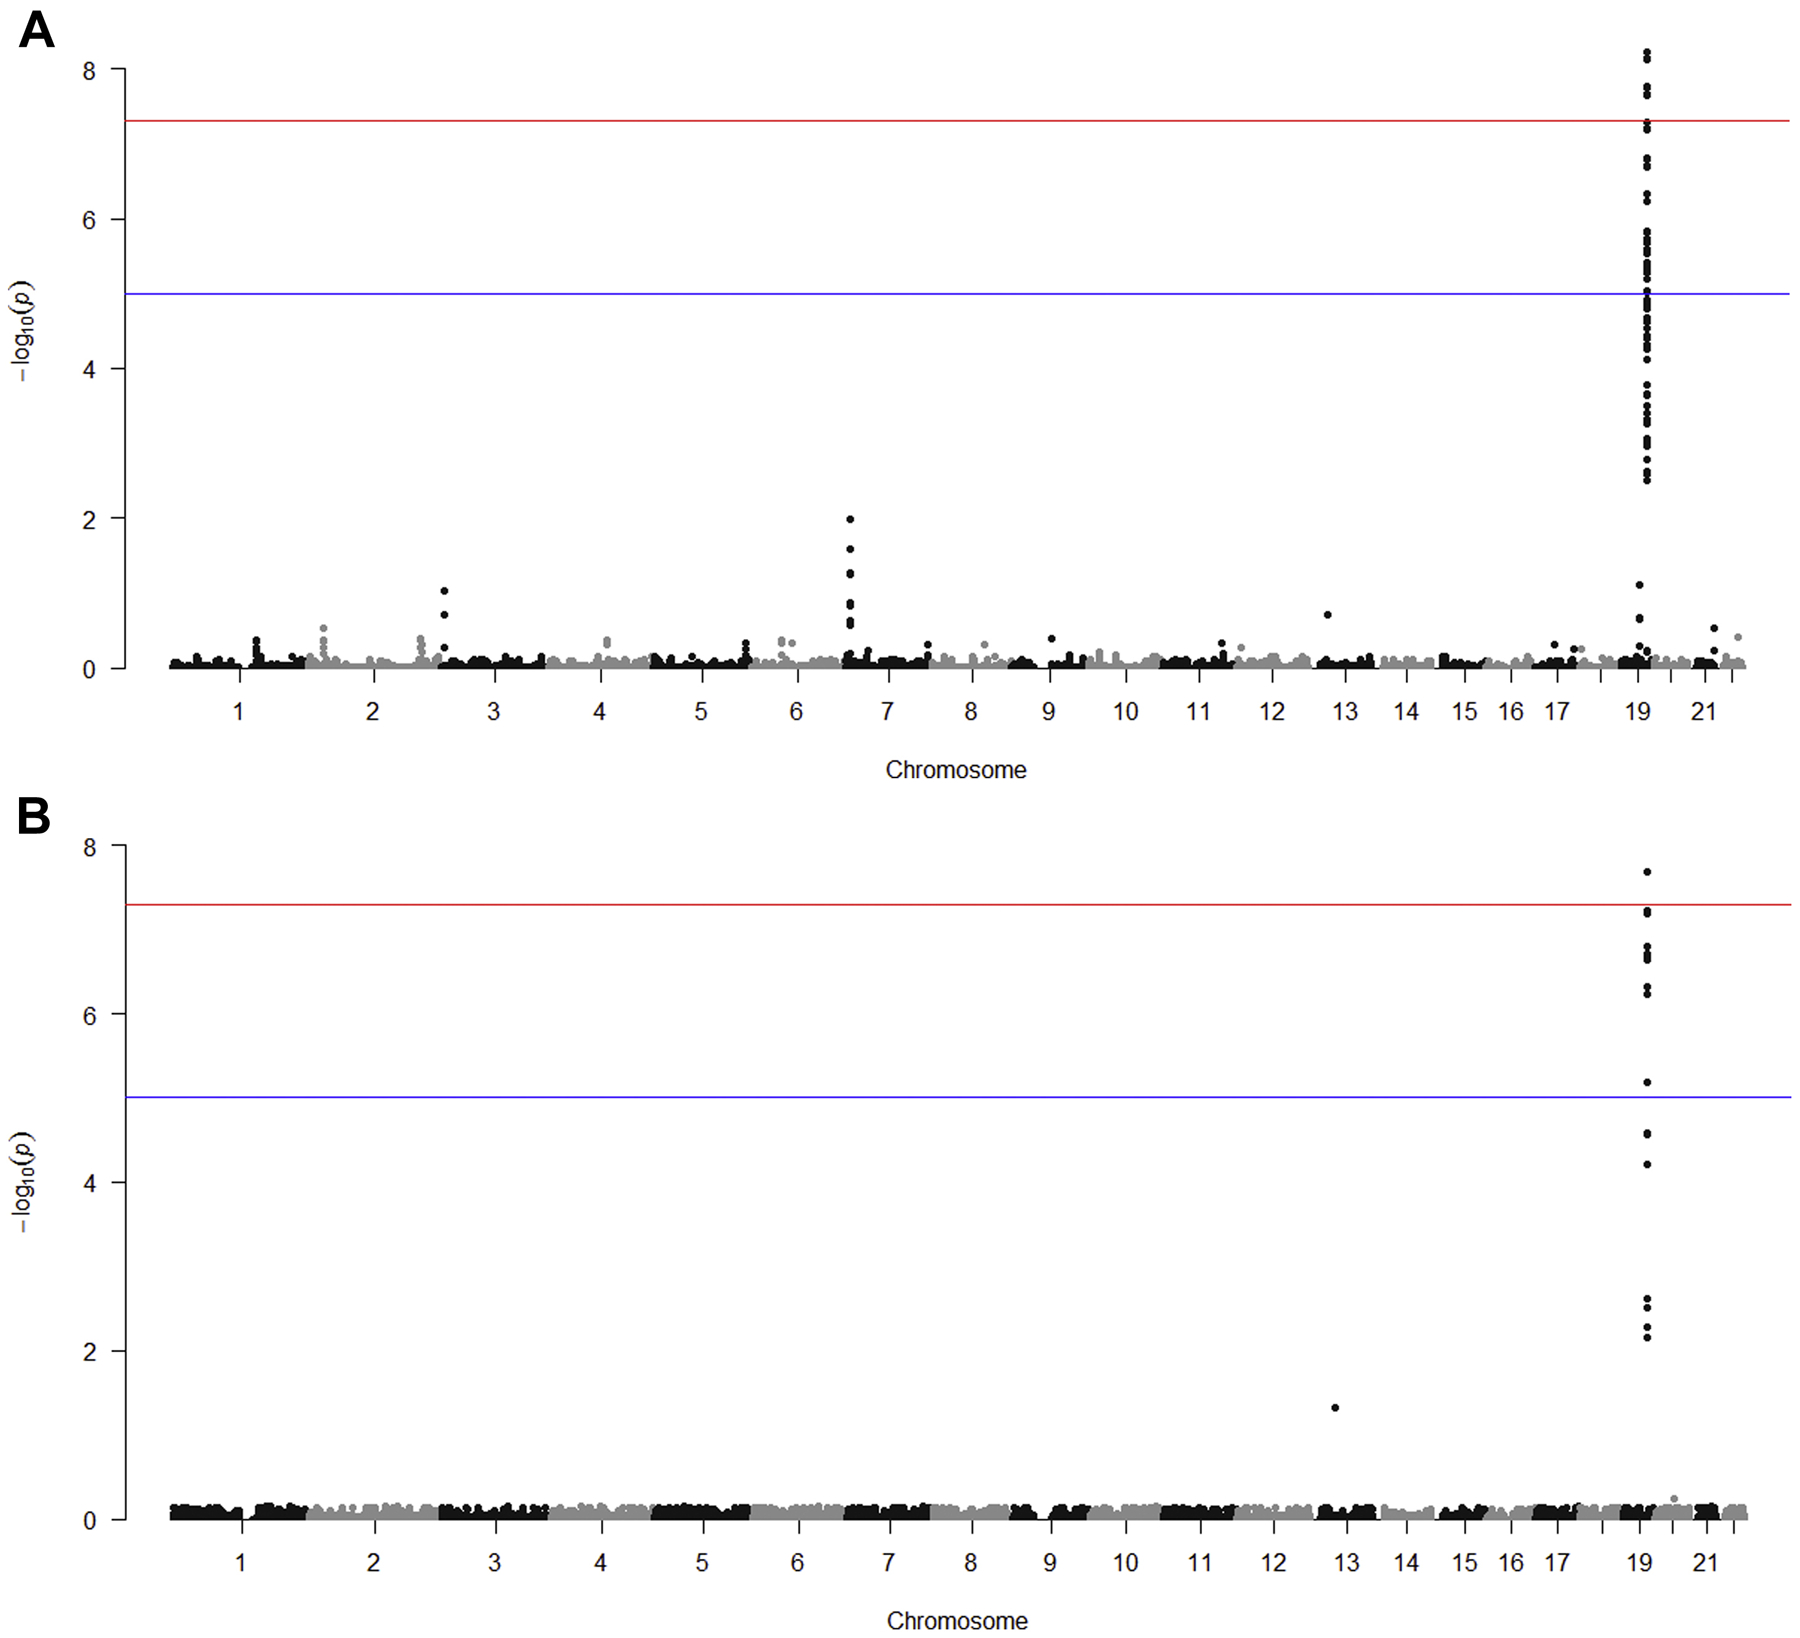
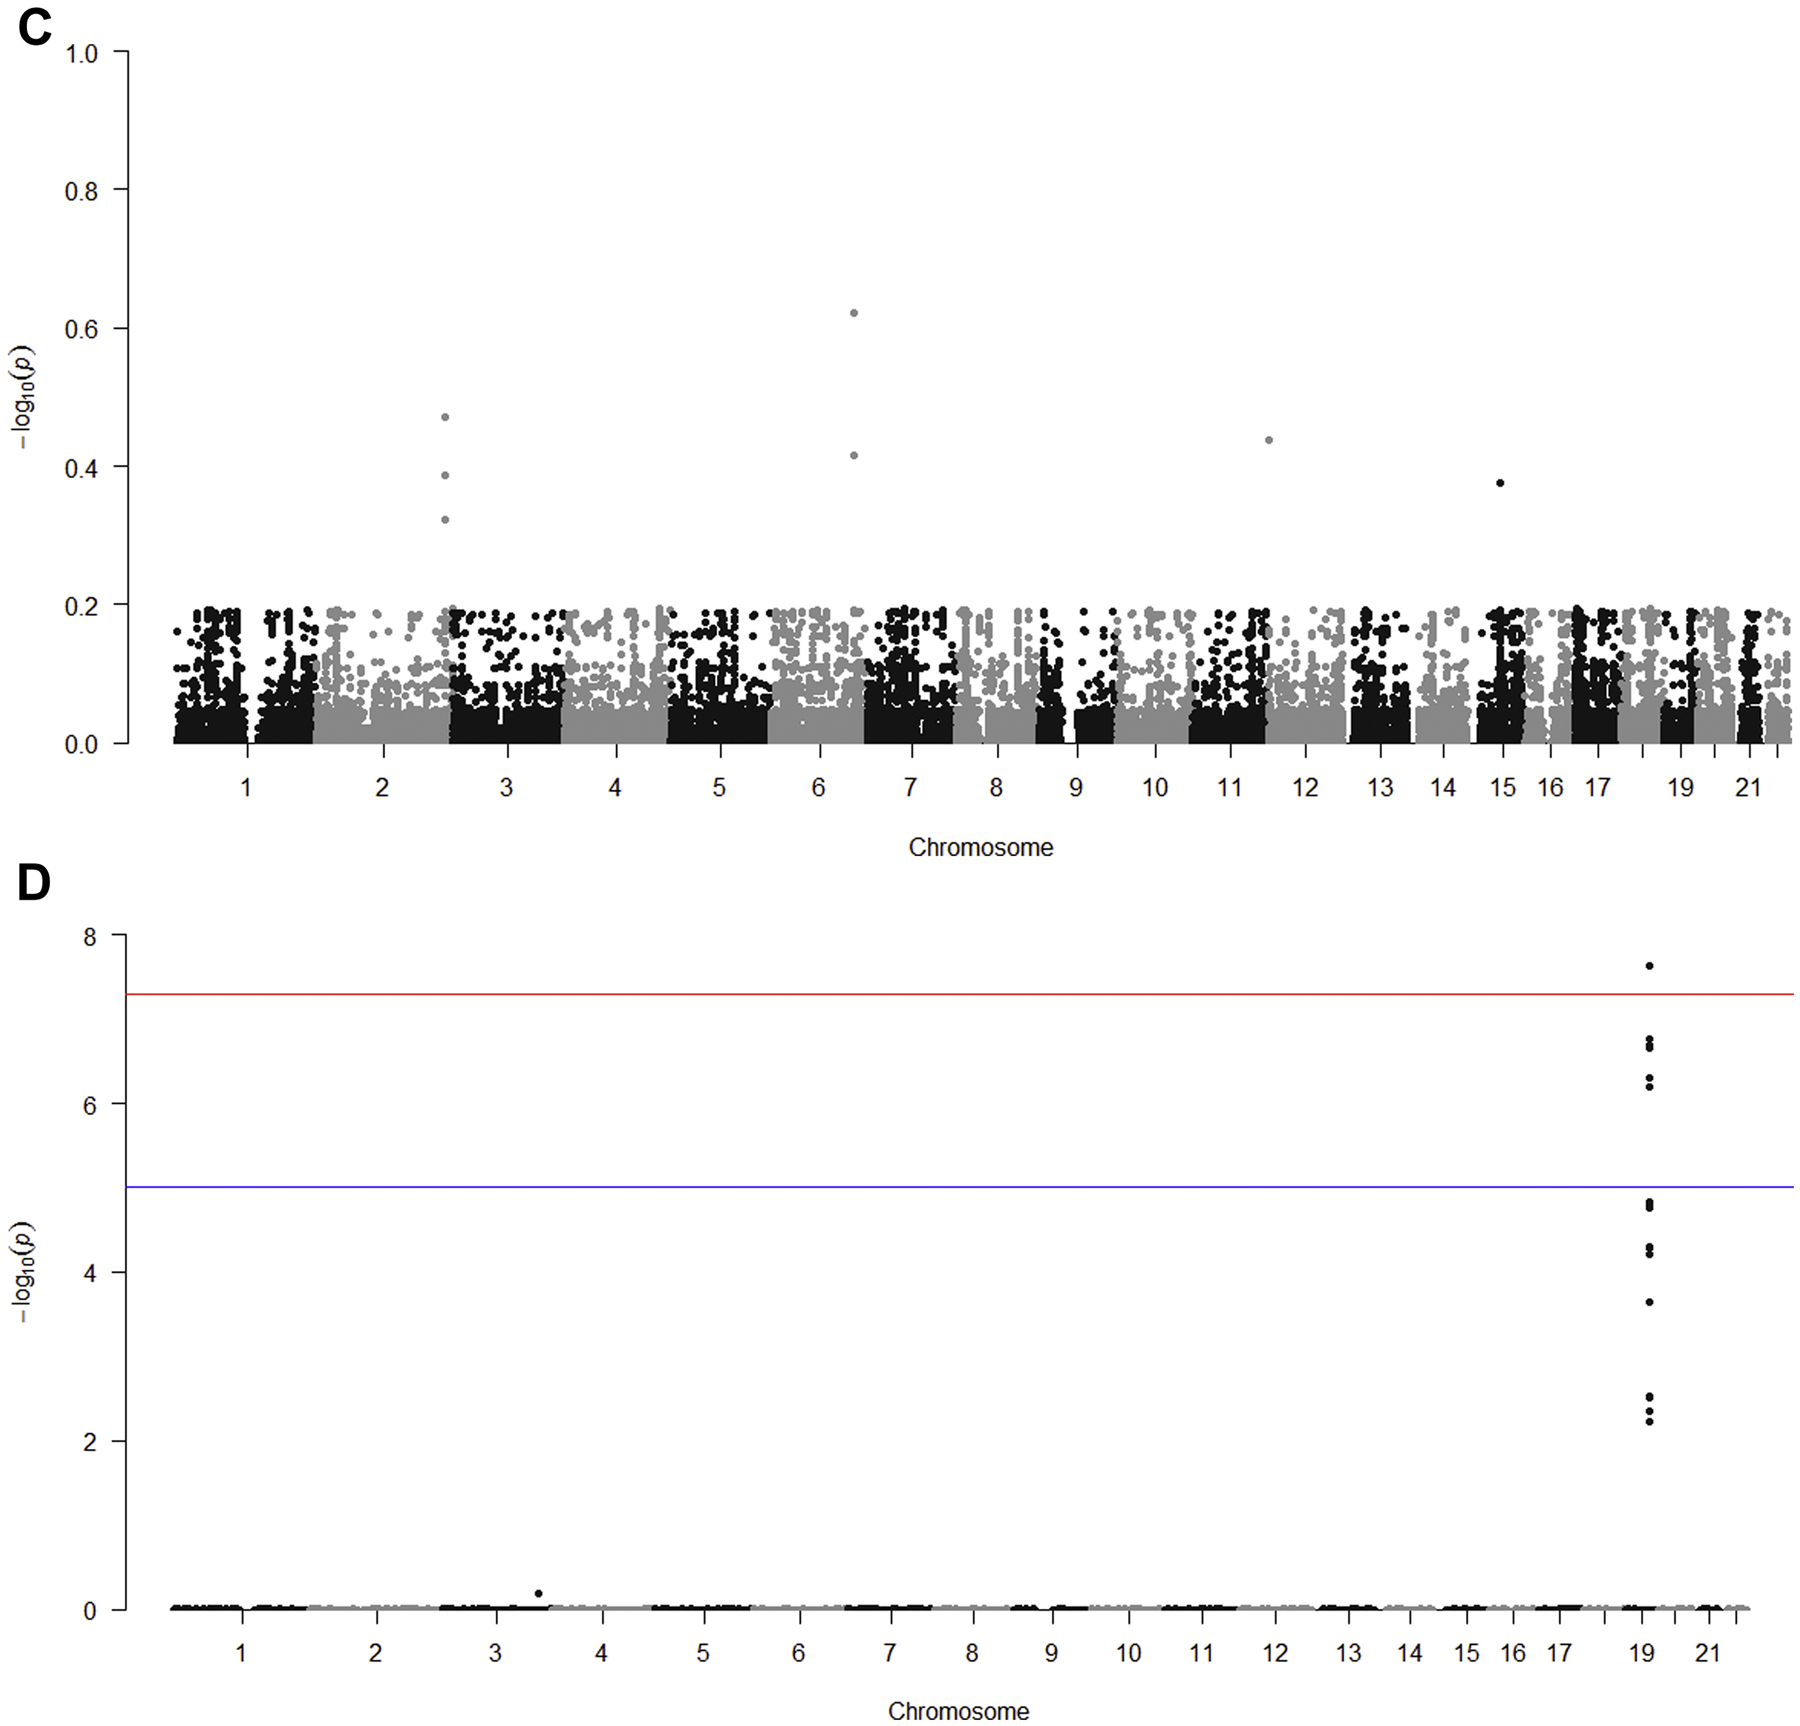
Conditional Manhattan plots show the FDR q value for cognitive impairment conditional on each of the four secondary phenotypes: CRP (Fig 3A), LDL (Fig 3B), HDL (Fig 3C) and TC (Fig 3D). Genome-wide significant line (red) is drawn at −log10(5 × 10⁻⁸), suggestive line (blue) is drawn at −log10(1 × 10⁻⁵).