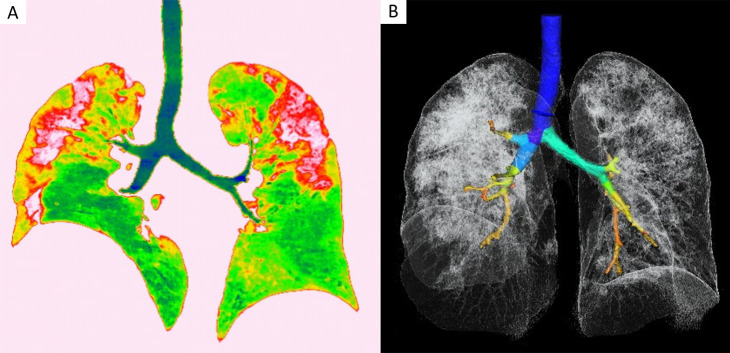
Figure 2:
CT images in a 54-year-old woman with severe COVID-19 pneumonia. A, The color coronal image highlights the distribution of lung lesions (red areas) because software is used to automatically segment and render. B, On a three-dimensional volume-rendering image, trachea, bronchus, lung tissues, and lesions are differentiated by CT values and automatically segmented.

