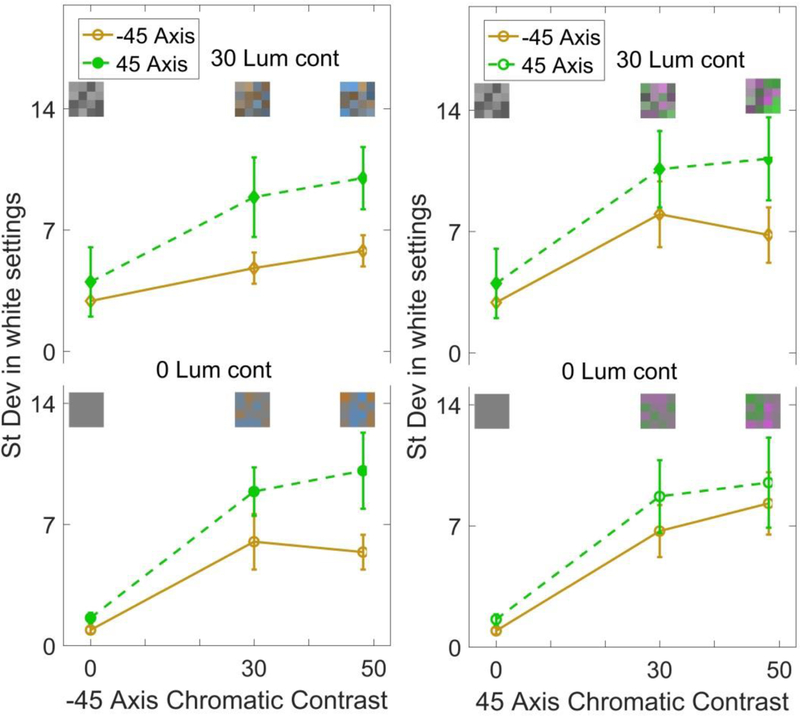
Figure 5.
Standard deviation of the achromatic settings for stimuli with chromatic contrast along the −45 deg axis (left) or +45 deg axis (right), and with a luminance contrast of 30 (top) or 0 (bottom). Points plot the mean and standard error across observers for the settings along the −45 deg axis (solid lines) or +45 deg axis (dashed lines).

