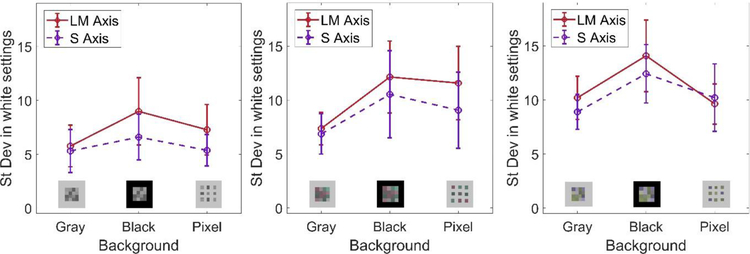
Figure 6.
Effect of the background on the settings. Each panel plots the standard deviation in the achromatic settings for a given stimulus array shown on a gray background, black background, or a gray background interleaved with the array elements. The three panels are for stimulus arrays that luminance contrast but no chromatic contrast (left), luminance contrast and LvM chromatic contrast (middle), or luminance contrast and SvsLM contrast (right). Points plot the mean and standard error across the observers for the adjustments along the LvsM (solid lines) and SvsLM (dashed lines) axes.

