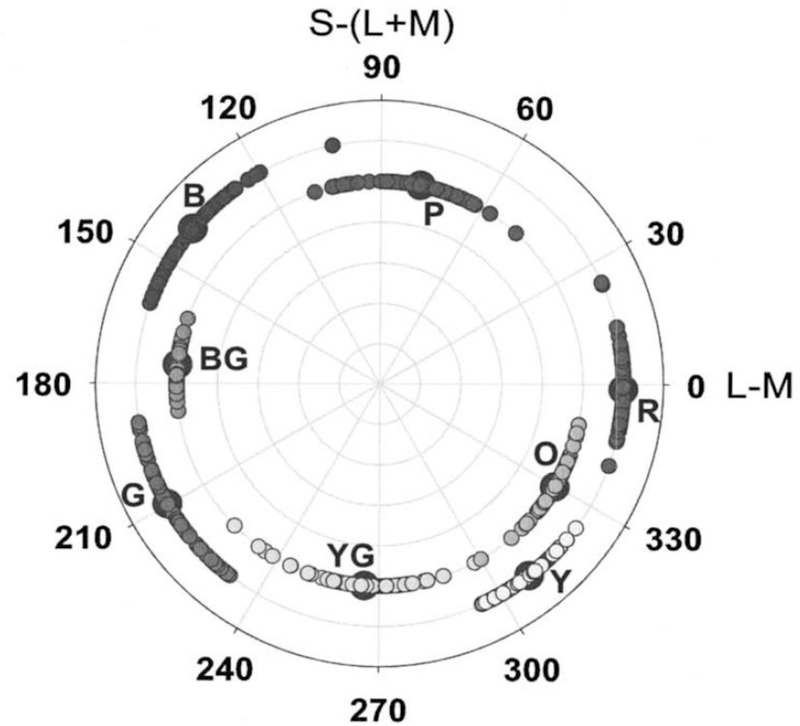
Figure 1.
Color categories relative to the cardinal axes. Symbols show the stimuli chosen as unique (Red, Green, Blue, Yellow) and binary (Purple, Orange, Yellow-Green, Blue-Green) hues by individual color-normal observers, plotted by their angle in the LvsM and SvsLM space (after [10]).

