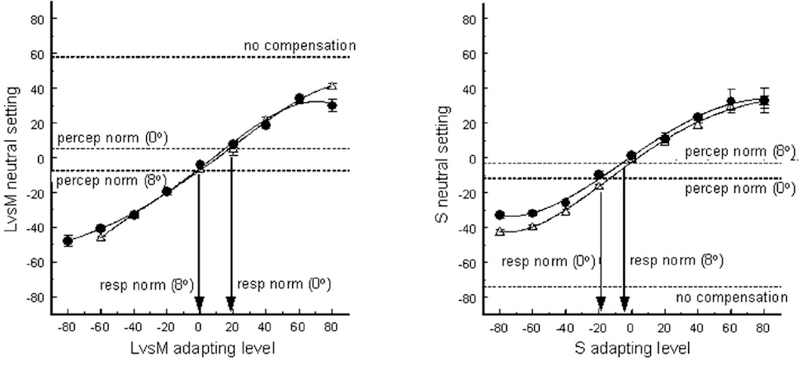
Figure 3.
Perceptual norms vs. sensitivity norms. Plots show chromatic adaptation in the fovea (circles) and 8-deg periphery (triangles). Shifts in the achromatic settings are plotted as a function of the chromaticity of the adapting stimulus along the LvsM (left) or SvsLM (right) axis. Aftereffects are similar at the two loci for the same adapting chromaticity, with a null in the aftereffect close to the stimulus level that was judged as achromatic under neutral (dark) adaptation (dashed lines labeled “percep norm”). Arrows indicate the adapting stimuli that did not alter the neutral achromatic settings (“resp norm”). Lines labeled “no compensation” show the vertical difference in the adapting curves at the two loci that would be predicted if the adaptation were instead controlled by equivalent spectra at the level of the receptors, after filtering by the macular pigment (based on estimated differences in macular pigment screening at the two loci) (after [53]).

