
Figure 1a.
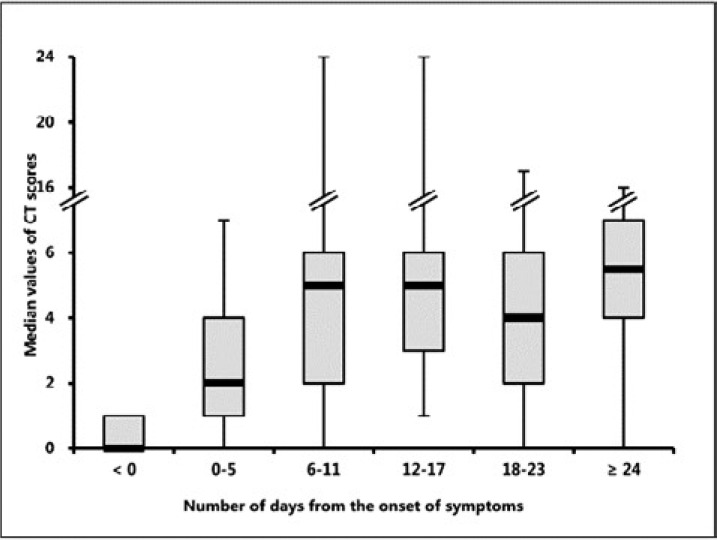
Temporal change of median values of total CT scores and number of zones involved. Both the median values of total CT scores (a) and number of zones involved (b) increased rapidly after symptom onset, peaked during illness days 6-11, and followed by persistence of high levels. The distribution of days when the peak total CT scores were reached was shown in (c). Note that 2 patients died after the first CT scan, resulting in a total of 88 peaking days.