
Figure 2a.
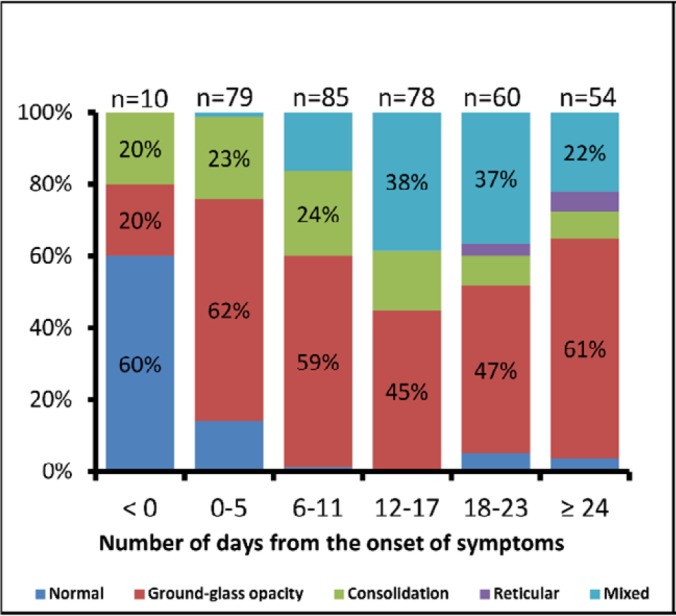
Temporal change of the main CT patterns and the subtypes of ground-glass opacity. Stacked-bar graphs showed the distribution of the main patterns of lung abnormalities (a) and the subtypes of ground-glass opacity (b) on CT scans at various time points from symptom onset. Categories with percentage ≥ 20% are shown. GGO = ground-glass opacity