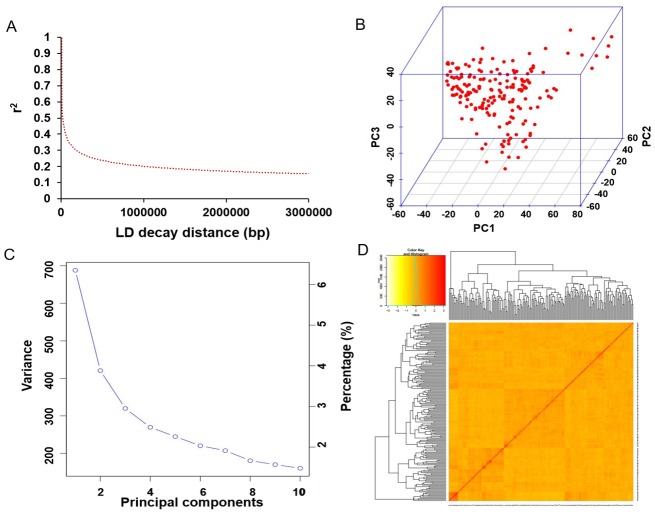
Fig 3. Genetic features of the mapping population.
(A) The linkage disequilibrium (LD) decay of the genome-wide association study (GWAS) population. (B) The first three principal components of the more than 20,000 SNPs used in the GWAS. (C) Population structure of soybean germplasm collection as reflected by principal components. (D) A heatmap of the kinship matrix among the 185 soybean accessions.

