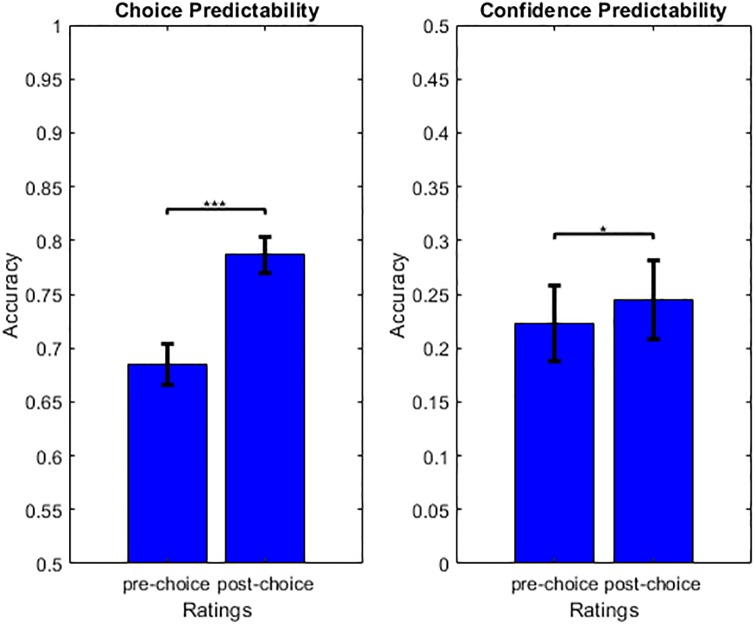
Fig 4. Prediction accuracy of choice and choice confidence.
Left: Mean choice prediction accuracy is plotted for pre-choice (left) and post-choice (right) value ratings. Right: Mean choice confidence prediction accuracy is plotted for pre-choice (left) versus post-choice (right) value and value uncertainty ratings. Error bars depict 95% confidence intervals.

