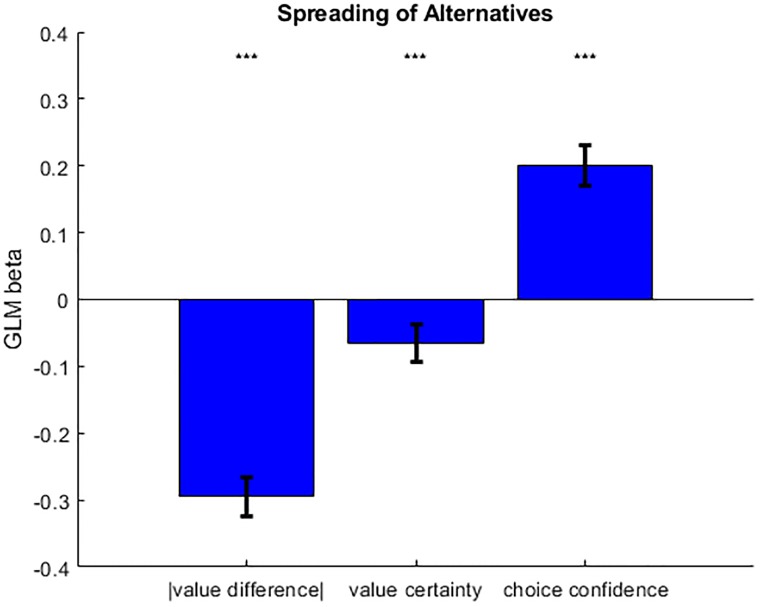
Fig 5. Observed relationships between meta-cognitive judgments and CIPC.
This figure shows the results of a multiple linear regression of CIPC onto absolute value difference, value certainty and choice confidence, in terms of the mean standardized regression coefficients (error bars depict 95% confidence intervals). Note that regressors were orthogonalized in that order, i.e. rightmost bars show partial correlation coefficients (after having accounted for the effects depicted by the leftmost bars). Compare this figure to Fig 1 above.

