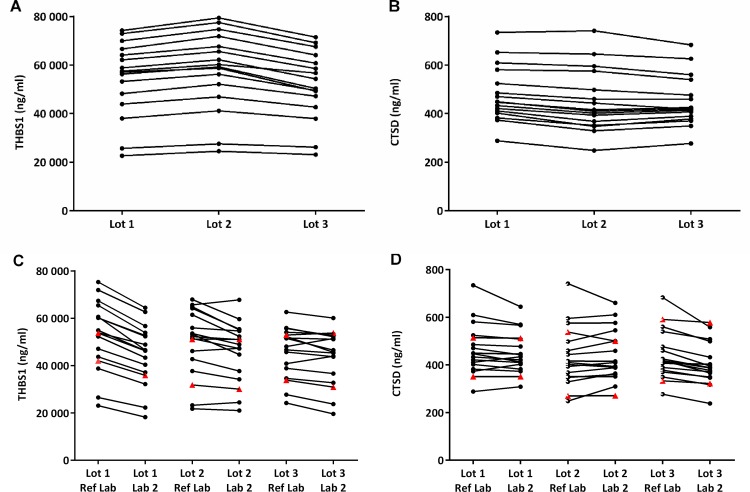
Fig 4. Concentration determination with different lots and by different laboratories.
(A and B) Reported are the averages of 6 determinations in reference laboratory (Ref Lab). (C and D) Reproducibility was tested by measuring samples in duplicate in n runs in reference laboratory (Ref Lab) and in independent laboratory (Lab 2). Reported are the concentration determinations of the averages of n runs (THBS1: Lot 1, n = 2; Lot 2 and 3, Ref Lab n = 1, Lab 2, n = 2. CTSD: always n = 2) of samples and controls. Each line represents one sample. Filled red triangles represent concentrations of controls.

