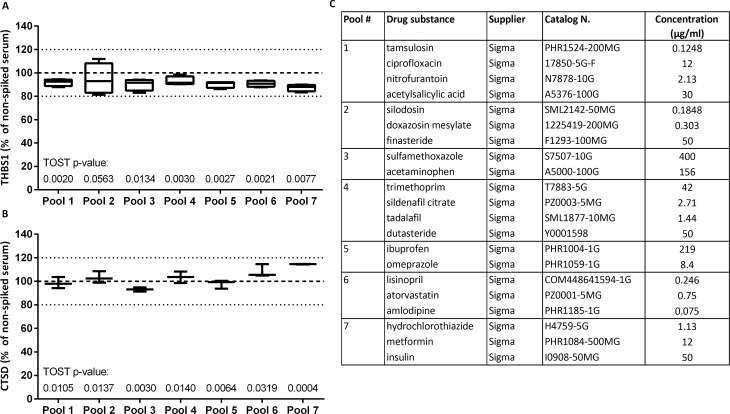
Fig 6. Impact of drug substances on measured marker levels.
THBS1 and CTSD were measured in serum samples before and after spiking 7 pools of drug substances. Plots show the median, the 25 to 75% percentile (boxes) and minimum to maximum (whiskers) of relative serum levels of THBS1 (n = 4) (A) and CTSD (n = 3) (B) in samples with potentially interfering drugs, taking as 100% reference the levels in the respective non-spiked serum (carrier buffer only). Reported are p-values for TOST equivalence testing. (C) Spiked concentration and compositions of pools.

