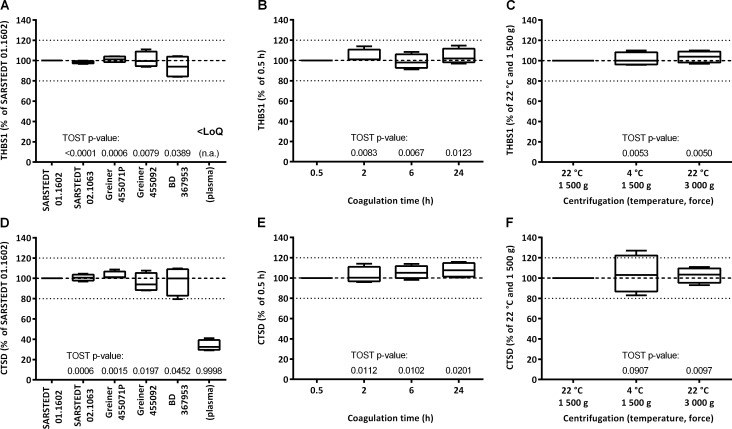
Fig 7. Relative marker levels in serum depending on sample preparation procedure.
Whole blood from matched donors was collected in different tubes (A and D), let stand at RT for different time before centrifugation (B and E), and centrifuged at different temperature and force for the separation of serum (C and F). Plots show the median, the 25 to 75% percentile (boxes) and minimum to maximum (whiskers) of relative serum levels of THBS1 (A, B, C) and CTSD (D, E, F), taking as 100% reference the respective concentrations in serum prepared with Sarstedt 01.1602 tubes (n = 4) (A and D), of the 0.5 h samples (n = 4) (B and E), and samples centrifuged at 1 500 g and 22°C (n = 4) (C and F). Reported are p-values for TOST equivalence testing (n.a., not applicable).

