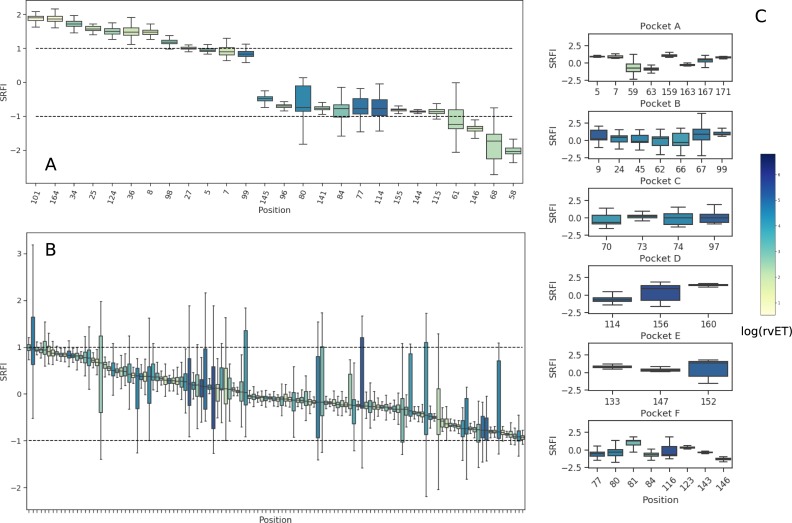
Fig 5. Box-plots of position-specific SRFI values for the HLA I peptide-binding groove.
(A) SRFI box-plots of selected minimally and highly frustrated residues within the HLA peptide binding groove (B) SRFI box-plots of positions with neutral frustration. (C) SRFI box-plots of peptide-binding pocket positions. Coloring according to log(rvET) values.

