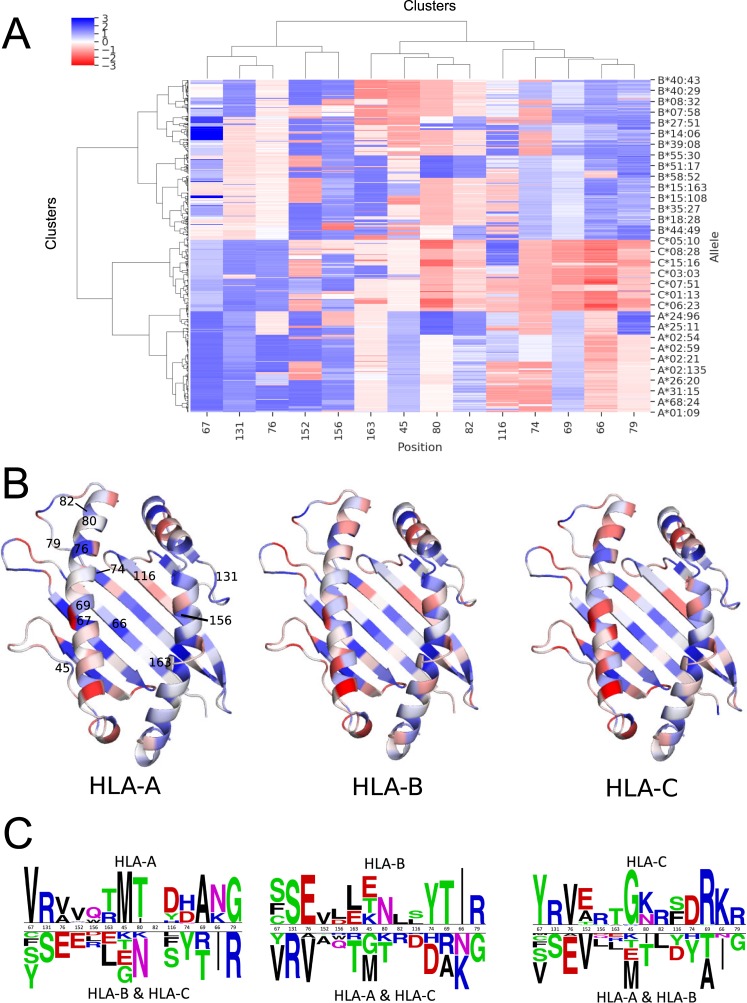
Fig 9. Clustering of allele-specific SRFI profiles based on 14 binding groove positions.
(A) SRFI cluster heatmap. Clustering was performed for all 1436 alleles included, yet not all of these alleles are indicated on axis label for clarity. (B) SRFI of three identified clusters corresponding to three HLA gene loci mapped onto the binding groove. Coloring as in Fig 5. (C) Sequence logos of clustering positions to highlight amino acid differences between allele in different clusters. The logos were generated using Two Sample Logo server [86].

