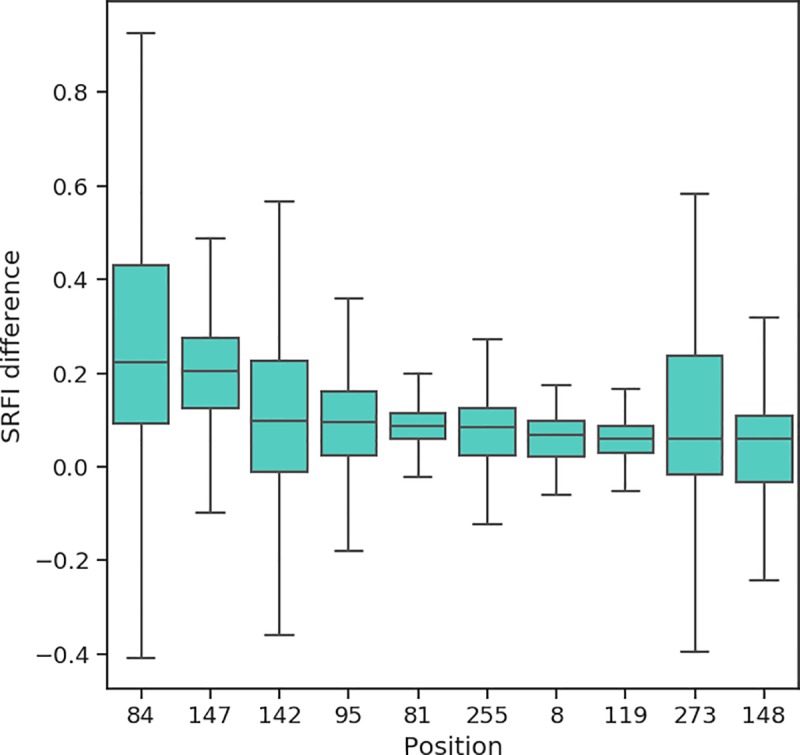
Fig 10. Box-plots of SRFI change upon peptide binding.

Positions are ordered from left to right according to decreasing change in median SRFI values. Note that the plot only includes top 10 positions showing the highest increase in SRFI levels upon peptide binding.
