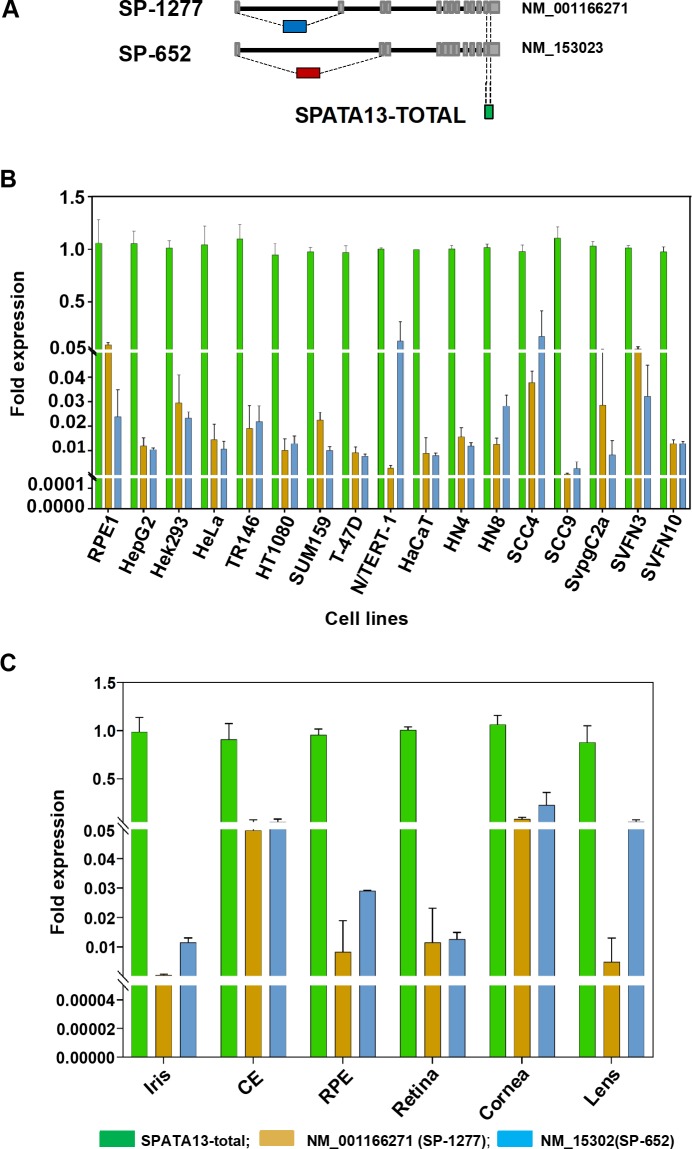
Fig 4. Expression of different SPATA13 transcripts in human cell lines and eye tissues.
(A) Schematic representation of the transcripts of different isoforms of SPATA13. The two isoform SP-1277 and SP-652 isoforms are generated by alternative splicing of exons toward the N-terminal. The position of qPCR primers used to differentiate the 2 transcripts are also shown. (B) Expression of SPATA13 transcripts by qPCR in 17 different cell lines derived from human eye, breast, liver, skin, head and neck, cervix and kidney. (C) Expression of SP-1277 and SP-652 transcripts in human iris, ciliary epithelium, retinal pigment epithelium, retina, cornea and lens. The green bars represent SPATA13-Total whereas the blue bars represent SP-1277 and the red bars represent SP-652.

